Metrics For Your Web Application's Dashboards
Whenever I create a dashboard for an application, it’s generally the same handful of metrics I look to. They’re the ones I always use to orient myself quickly when Pagerduty fires. They give me the grand overview, and then I’ll know what logging queries to start writing, code to look at, box to SSH into, or mitigation to activate. The same metrics are able to tell me during the day whether the system is ok, and I use them to do napkin math on e.g. capacity planning and imminent bottlenecks:
- Web Backend (e.g. Django, Node, Rails, Go, ..)
- Response Time
p50,p90,p99,sum,avg† - Throughput by HTTP status †
- Worker Utilization 1
- Request Queuing Time 2
- Service calls †
- Database(s), caches, internal services, third-party APIs, ..
- Enqueued jobs are important!
- Circuit Breaker tripping †
/min - Errors, throughput, latency
p50,p90,p99
- Throttling †
- Cache hits and misses
%† - CPU and Memory Utilization
- Exception counts †
/min
- Response Time
- Job Backend (e.g. Sidekiq, Celery, Bull, ..)
- Job Execution Time
p50,p90,p99,sum,avg† - Throughput by Job Status
{error, success, retry}† - Worker Utilization 3
- Time in Queue † 4
- Queue Sizes † 5
- Don’t forget scheduled jobs and retries!
- Service calls
p50,p90,p99,count,by type† - Throttling †
- CPU and Memory Utilization
- Exception counts †
/min
- Job Execution Time
† Metrics where you need the ability to slice by endpoint or job,
tenant_id, app_id, worker_id, zone, hostname, and queue (for jobs).
This is paramount to be able to figure out if it’s a single endpoint, tenant, or
app that’s causing problems.
You can likely cobble a workable chunk of this together from your existing service provider and APM. The value is for you to know what metrics to pay attention to, and which key ones you’re missing. The holy grail is one dashboard for web, and one for job. The more incidents you have, the more problematic it becomes that you need to visit a dozen URLs to get the metrics you need.
If you have little of this and need somewhere to start, start with logs. They’re the lowest common denominator, and if you’re productive in a good logging system that will you very far. You can build all these dashboards with logs alone. Jumping into the detailed logs is usually the next step you take during an incident if it’s not immediately clear what to do from the metrics.
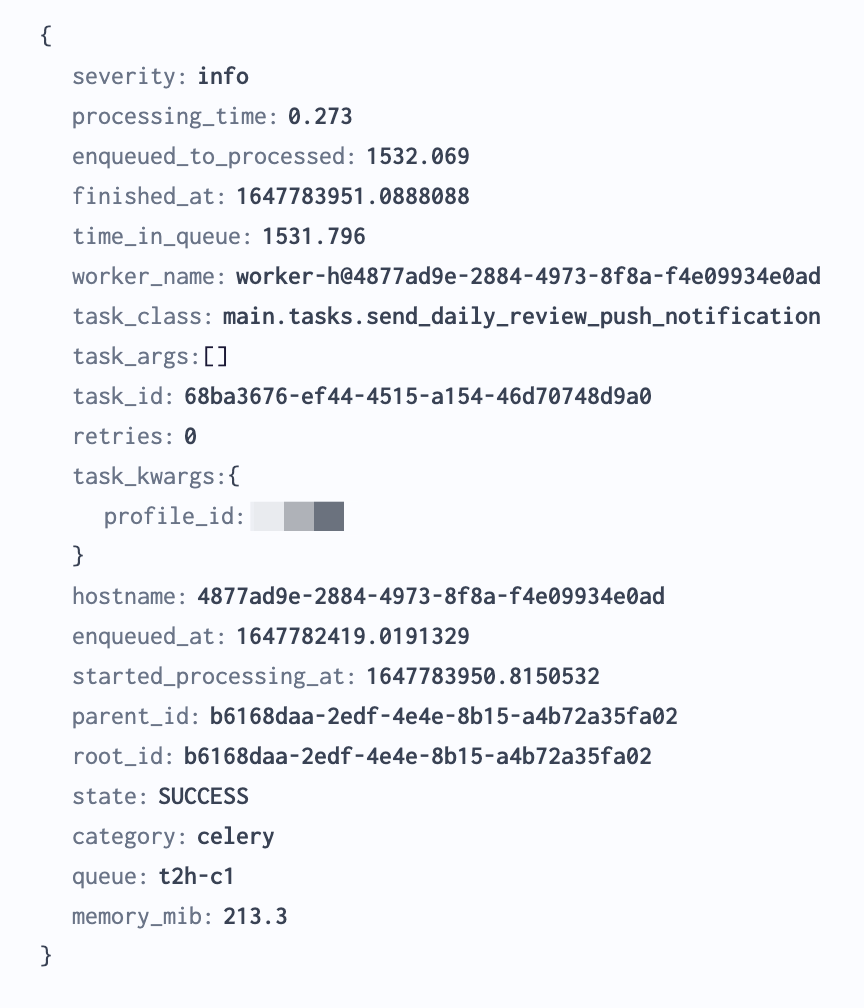
Use the canonical log line pattern (see figure below), resist emitting random logs throughout the request as this makes analysis difficult. A canonical log line is a log emitted at the end of the request with everything that happened during the request. This makes querying the logs bliss.

Surprisingly, there aren’t good libraries available for the canonical log line pattern, so I recommend rolling your own. Create a middleware in your job and web stack to emit the log at the end of the request. If you need to accumulate metrics throughout the request for the canonical log line, create a thread-local dictionary for them that you flush in the middleware.
For response time from services, you will need to emit inline logs or metrics. Consider using an OpenTelemetry library so you only need to instrument once and can later add sinks for canonical logs (the sum), metrics, profiling, and traces.
Notably absent here is monitoring a database, which would take its own post.
Hope this helps you step up your monitoring game. If there’s a metric you feel strongly that’s missing, please let me know!
Footnotes
-
This is one of my favorites. What percentage of threads are currently busy? If this is
>80%, you will start to see counter-intuitive queuing theory take hold, yielding strange response time patterns.
It is given asbusy_threads / total_threads. ↩ -
How long are requests spending in TCP/proxy queues before being picked up by a thread? Typically you get this by your load-balancer stamping the request with a
X-Request-Startheader, then subtracting that from the current time in the worker thread. ↩ -
Same idea as web utilization, but in this case it’s OK for it to be > 80% for periods of time as jobs are by design allowed to be in the queue for a while. The central metric for jobs becomes time in queue. ↩
-
The central metric for monitoring a job stack is to know how long jobs spend in the queue. That will be what you can use to answer questions such as: Do I need more workers? When will I recover? What’s the experience for my users right now? ↩
-
How large is your queue right now? It’s especially amazing to be able to slice this by job and queue, but your canonical logs with how much has been enqueued is typically sufficient. ↩