MySQL transactions per second vs fsyncs per second
Just wondering how many transactions or writes per second MySQL can handle? While it depends on many factors, fundamentally, about as many transactions as MySQL can commit to disk per second. A modern disk can do ~1000 fsyncs per second, but MySQL will group multiple writes with each fsync. An okay rule-of-thumb would be 5000-15,000 writes per second, depending on things like writes per transaction, number of indexes, hardware, size of writes, etc. Read the article to understand this in more depth!
Napkin friends, from near and far, it’s time for another napkin problem!
Since the beginning of this newsletter I’ve posed problems for you to try to answer. Then in the next month’s edition, you hear my answer. Talking with a few of you, it seems many of you read these as posts regardless of their problem-answer format.
That’s why I’ve decided to experiment with a simpler format: posts where I both present a problem and solution in one go. This one will be long, since it’ll include an answer to last month’s.
Hope you enjoy this format! As always, you are encouraged to reach out with feedback.
Problem 10: Is MySQL’s maximum transactions per second equivalent to fsyncs per second?
How many transactions (‘writes’) per second is MySQL capable of?
A naive model of how a write (a SQL insert/update/delete) to an ACID-compliant database like MySQL works might be the following (this applies equally to Postgres, or any other relational/ACID-compliant databases, but we’ll proceed to work with MySQL as it’s the one I know best):
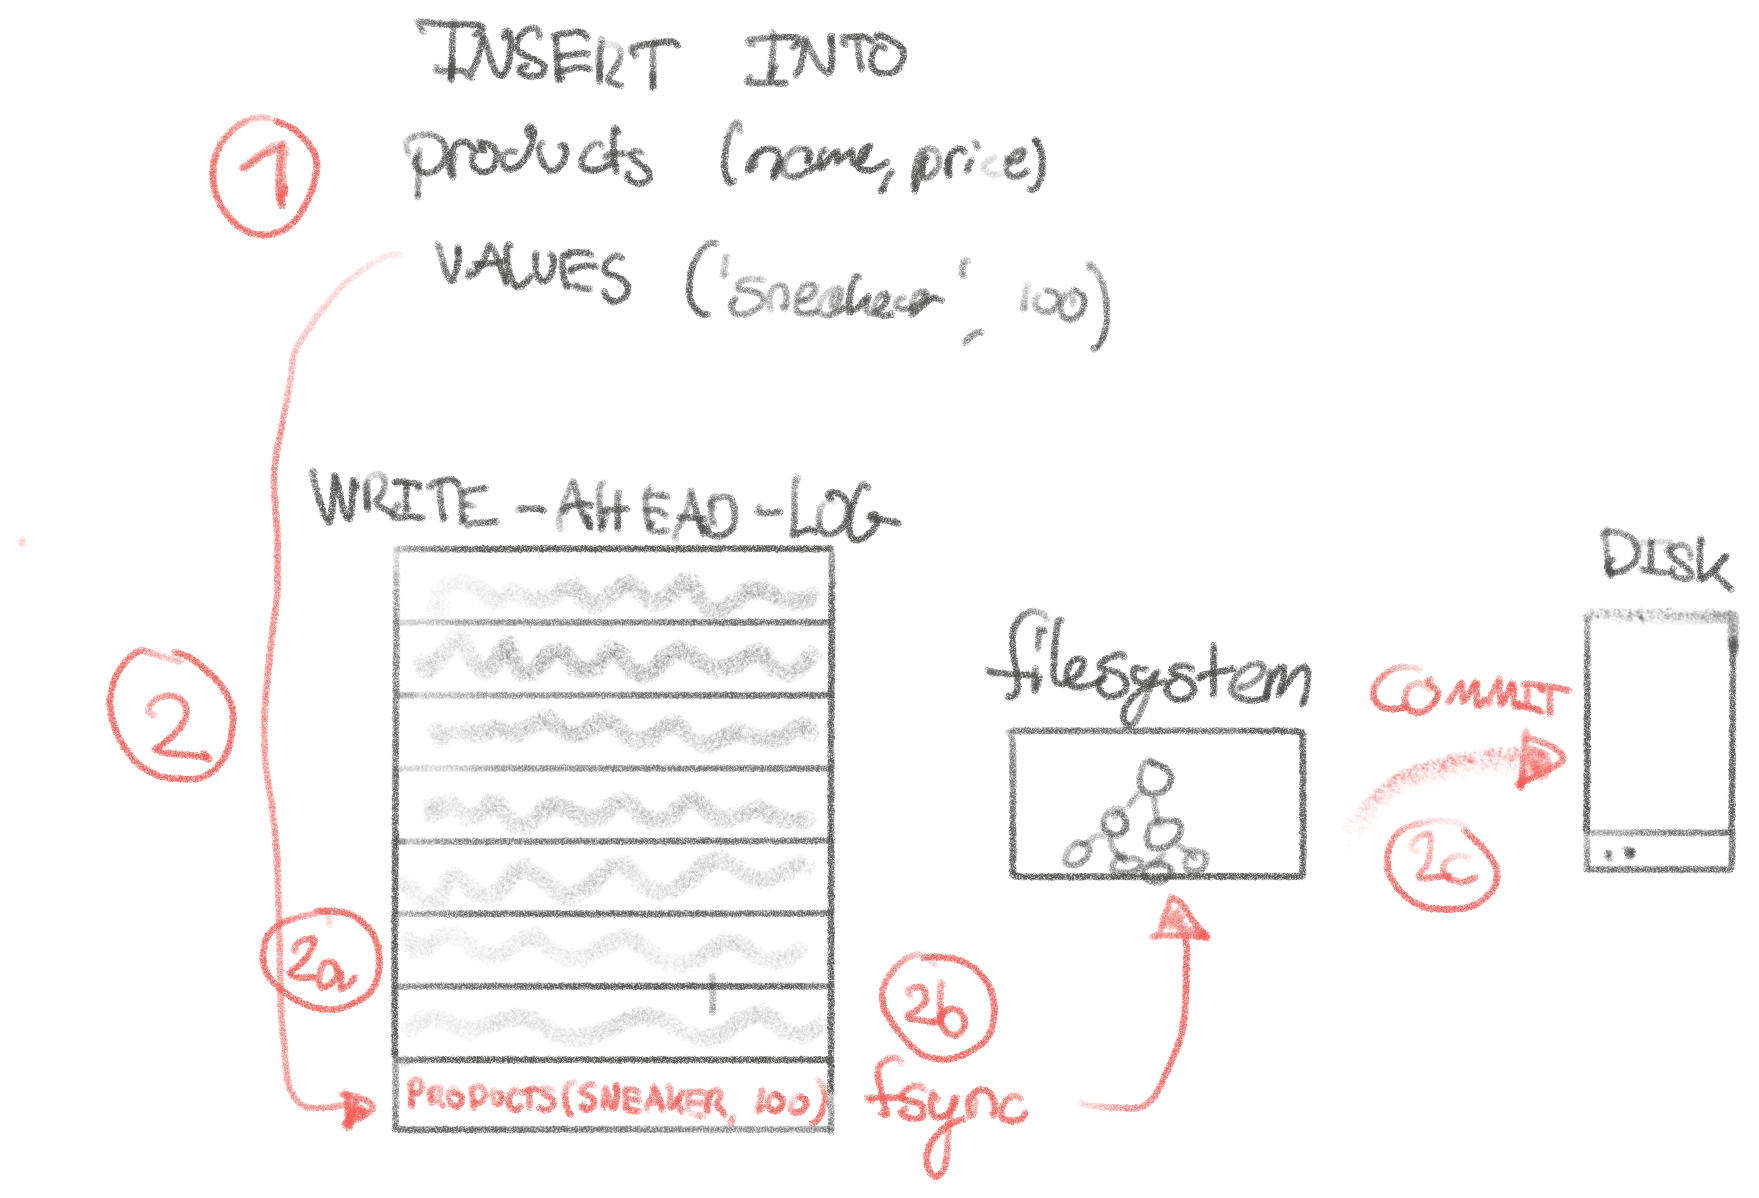
- Client sends query to MySQL over an existing connection:
INSERT INTO products (name, price) VALUES ('Sneaker', 100) - MySQL inserts the new record to the write-ahead-log (WAL) and calls
fsync(2)to tell the operating system to tell the filesystem to tell the disk to make sure that this data is for sure, pinky-swear committed to the disk. This step, being the most complex, is depicted below. - MySQL inserts the record into an in-memory page in the backing storage engine
(InnoDB) so the record will be visible to subsequent queries. Why commit to
the storage engine and the WAL? The storage engine is optimized for serving
query results the data, and the WAL for writing it in a safe manner — we
can’t serve a
SELECTefficiently from the WAL! - MySQL returns
OKto the client. - MySQL eventually calls
fsync(2)to ensure InnoDB commits the page to disk.
In the event of power-loss at any of these points, the behaviour can be defined without nasty surprises, upholding our dear ACID-compliance.
Splendid! Now that we’ve constructed a naive model of how a relational database
might handle writes safely, we can consider the latency of inserting a new
record into the database. When we consult the reference napkin numbers, we
see that the fsync(2) in step (2) is by far the slowest operation in the
blocking chain at 1 ms.
For example, the network handling at step (1) takes roughly ~ (TCP Echo
Server is what we can classify as ‘the TCP overhead’). The write(2) itself
prior to the fsync(2) is also negligible at ~, since this system call
essentially just writes to an in-memory buffer (the ‘page cache’) in the kernel.
This doesn’t guarantee the actual bits are committed on disk, which means an
unexpected loss of power would erase the data, dropping our ACID-compliance on
the floor. Calling fsync(2) guarantees us the bits are persisted on the disk,
which will survive an unexpected system shutdown. Downside is that it’s 100x
slower.
With that, we should be able to form a simple hypothesis on the maximum throughput of MySQL:
The maximum theoretical throughput of MySQL is equivalent to the maximum number of
fsync(2)per second.
We know that fsync(2) takes 1 ms from earlier, which means we would naively
expect that MySQL would be able to perform in the neighbourhood of: 1s / 1ms/fsync = 1000 fsyncs/s = 1000 transactions/s .
Excellent. We followed the first three of the napkin math steps: (1) Model the system, (2) Identify the relevant latencies, (3) Do the napkin math, (4) Verify the napkin calculations against reality.
On to (4: Verifying)! We’ll write a simple benchmark in Rust that writes to MySQL with 16 threads, doing 1,000 insertions each:
for i in 0..16 {
    handles.push(thread::spawn({
        let pool = pool.clone();
        move || {
            let mut conn = pool.get_conn().unwrap();
            // TODO: we should ideally be popping these off a queue in case of a stall
            // in a thread, but this is likely good enough.
            for _ in 0..1000 {
                conn.exec_drop(
                    r"INSERT INTO products (shop_id, title) VALUES (:shop_id, :title)",
                    params! { "shop_id" => 123, "title" => "aerodynamic chair" },
                )
                .unwrap();
            }
        }
    }));

    for handle in handles {
      handle.join().unwrap();
    }
    // 3 seconds, 16,000 insertions
}
This takes ~3 seconds to perform 16,000 insertions, or ~5,300 insertions per
second. This is 5x more than the 1,000 fsync per second our napkin math
told us would be the theoretical maximum transactional throughput!
Typically with napkin math we aim for being within an order of magnitude, which we are. But, when I do napkin math it usually establishes a lower-bound for the system, i.e. from first-principles, how fast could this system perform in ideal circumstances?
Rarely is the system 5x faster than napkin math. When we identify a significant-ish gap between the real-life performance and the expected performance, I call it the “first-principle gap.” This is where curiosity sets in. It typically means there’s (1) an opportunity to improve the system, or (2) a flaw in our model of the system. In this case, only (2) makes sense, because the system is faster than we predicted.
What’s wrong with our model of how the system works? Why aren’t fsyncs per second equal to transactions per second?
First I examined the benchmark… is something wrong? Nope SELECT COUNT(*) FROM products says 16,000. Is the MySQL I’m using configured to not fsync on every
write? Nope, it’s at the safe default.
Then I sat down and thought about it. Perhaps MySQL is not doing an fsync
for every single write? If it’s processing 5,300 insertions per second,
perhaps it’s batching multiple writes together as part of writing to the WAL,
step (2) above? Since each transaction is so short, MySQL would benefit from
waiting a few microseconds to see if other transactions want to ride along
before calling the expensive fsync(2).
We can test this hypothesis by writing a simple bpftrace script to observe the
number of fsync(1) for the ~16,000 insertions:
tracepoint:syscalls:sys_enter_fsync,tracepoint:syscalls:sys_enter_fdatasync
/comm == "mysqld"/
{
        @fsyncs = count();
}
Running this during the ~3 seconds it takes to insert the 16,000 records we get
~8,000 fsync calls:
$ sudo bpftrace fsync_count.d
Attaching 2 probes...
^C

@fsyncs: 8037
This is a peculiar number. If MySQL was batching fsyncs, we’d expect something
far lower. This number means that we’re on average doing ~2,500 fsync per
second, at a latency of ~0.4ms. This is twice as fast as the fsync latency we
expect, the 1ms mentioned earlier. For sanity, I ran the script to benchmark
fsync outside MySQL again, no, still 1ms. Looked at the
distribution, and it was consistently ~1ms.
So there’s two things we can draw from this: (1) We’re able to fsync more than
twice as fast as we expect, (2) Our hypothesis was correct that MySQL is more
clever than doing one fsync per transaction, however, since fsync also was
faster than expected, this didn’t explain everything.
If you remember from above, while committing the transaction could theoretically
be a single fsync, other features of MySQL might also call fsync. Perhaps
they’re adding noise?
We need to group fsync by file descriptor to get a better idea of how MySQL
uses fsync. However, the raw file descriptor number doesn’t tell us much. We
can use readlink and the proc file-system to obtain the file name the file
descriptor points to. Let’s write a bpftrace script to see what’s being
fsync’ed:
tracepoint:syscalls:sys_enter_fsync,tracepoint:syscalls:sys_enter_fdatasync
/comm == str($1)/
{
  @fsyncs[args->fd] = count();
  if (@fd_to_filename[args->fd]) {
  } else {
    @fd_to_filename[args->fd] = 1;
    system("echo -n 'fd %d -> ' &1>&2 | readlink /proc/%d/fd/%d",
           args->fd, pid, args->fd);
  }
}

END {
  clear(@fd_to_filename);
}
Running this while inserting the 16,000 transactions into MySQL gives us:
personal@napkin:~$ sudo bpftrace --unsafe fsync_count_by_fd.d mysqld
Attaching 5 probes...
fd 5 -> /var/lib/mysql/ib_logfile0 # redo log, or write-ahead-log
fd 9 -> /var/lib/mysql/ibdata1 # shared mysql tablespace
fd 11 -> /var/lib/mysql/#ib_16384_0.dblwr # innodb doublewrite-buffer
fd 13 -> /var/lib/mysql/undo_001 # undo log, to rollback transactions
fd 15 -> /var/lib/mysql/undo_002 # undo log, to rollback transactions
fd 27 -> /var/lib/mysql/mysql.ibd # tablespace
fd 34 -> /var/lib/mysql/napkin/products.ibd # innodb storage for our products table
fd 99 -> /var/lib/mysql/binlog.000019 # binlog for replication
^C

@fsyncs[9]: 2
@fsyncs[12]: 2
@fsyncs[27]: 12
@fsyncs[34]: 47
@fsyncs[13]: 86
@fsyncs[15]: 93
@fsyncs[11]: 103
@fsyncs[99]: 2962
@fsyncs[5]: 4887
What we can observe here is that the majority of the writes are to the “redo
log”, what we call the “write-ahead-log” (WAL). There’s a few fsync calls to
commit the InnoDB table-space, not nearly as often, as we can always recover
this from the WAL in case we crash between them. Reads work just fine prior to
the fsync, as the queries can simply be served out of memory from InnoDB.
The only surprising thing here is the substantial volume of writes to the
binlog, which we haven’t mentioned before. You can think of the binlog as the
“replication stream.” It’s a stream of events such as row a changed from x to y, row b was deleted, and table u added column c. The primary replica
streams this to the read-replicas, which use it to update their own data.
When you think about it, the binlog and the WAL need to be kept exactly in
sync. We can’t have something committed on the primary replica, but not
committed to the replicas. If they’re not in sync, this could cause loss of data
due to drift in the read-replicas. The primary could commit a change to the WAL,
lose power, recover, and never write it to the binlog.
Since fsync(1) can only sync a single file-descriptor at a time, how can you
possibly ensure that the binlog and the WAL contain the transaction?
One solution would be to merge the binlog and the WAL into one log. I’m not
entirely sure why that’s not the case, but likely the reasons are historic. If
you know, let me know!
The solution employed by MySQL is to use a 2-factor commit. This requires three
fsyncs to commit the transaction. This and this reference explain
this process in more detail. Because the WAL is touched twice as part of the
2-factor commit, it explains why we see roughly ~2x the number of fsync to
that over the bin-log from the bpftrace output above. The process of grouping
multiple transactions into one 2-factor commit in MySQL is called ‘group commit.’
What we can gather from these numbers is that it seems the ~16,000 transactions were, thanks to group commit, reduced into ~2885 commits, or ~5.5 transactions per commit on average.
But there’s still one other thing remaining… why was the average latency per
fsync twice as fast as in our benchmark? Once again, we write a simple
bpftrace script:
tracepoint:syscalls:sys_enter_fsync,tracepoint:syscalls:sys_enter_fdatasync
/comm == "mysqld"/
{
        @start[tid] = nsecs;
}

tracepoint:syscalls:sys_exit_fsync,tracepoint:syscalls:sys_exit_fdatasync
/comm == "mysqld"/
{
        @bytes = lhist((nsecs - @start[tid]) / 1000, 0, 1500, 100);
        delete(@start[tid]);
}
Which throws us this histogram, confirming that we’re seeing some very fast
fsyncs:
personal@napkin:~$ sudo bpftrace fsync_latency.d
Attaching 4 probes...
^C

@bytes:
[0, 100)             439 |@@@@@@@@@@@@@@@                                     |
[100, 200)             8 |                                                    |
[200, 300)             2 |                                                    |
[300, 400)           242 |@@@@@@@@                                            |
[400, 500)          1495 |@@@@@@@@@@@@@@@@@@@@@@@@@@@@@@@@@@@@@@@@@@@@@@@@@@@@|
[500, 600)           768 |@@@@@@@@@@@@@@@@@@@@@@@@@@                          |
[600, 700)           376 |@@@@@@@@@@@@@                                       |
[700, 800)           375 |@@@@@@@@@@@@@                                       |
[800, 900)           379 |@@@@@@@@@@@@@                                       |
[900, 1000)          322 |@@@@@@@@@@@                                         |
[1000, 1100)         256 |@@@@@@@@                                            |
[1100, 1200)         406 |@@@@@@@@@@@@@@                                      |
[1200, 1300)         690 |@@@@@@@@@@@@@@@@@@@@@@@@                            |
[1300, 1400)         803 |@@@@@@@@@@@@@@@@@@@@@@@@@@@                         |
[1400, 1500)         582 |@@@@@@@@@@@@@@@@@@@@                                |
[1500, ...)         1402 |@@@@@@@@@@@@@@@@@@@@@@@@@@@@@@@@@@@@@@@@@@@@@@@@    |
To understand exactly what’s going on here, we’d have to dig into the
file-system we’re using. This is going to be out of scope (otherwise I’m never
going to be sending anything out). But, to not leave you completely hanging,
presumably, ext4 is using techniques similar to MySQL’s group commit to batch
writes together in the journal (equivalent to the write-ahead-log of MySQL). In
ext4’s vocabulary, this seems to be called max_batch_time, but the
documentation on this is scanty at best. The disk could also be doing this in
addition/instead of the file-system. If you know more about this, please
enlighten me!
The bottom-line is that fsync can perform faster during real-life workloads than the
1 ms I obtain on this machine from repeatedly writing and fsyncing a file. Most
likely from the ext4 equivalent of group commit, which we won’t see on a
benchmark that never does multiple fsyncs in parallel.
This brings us back around to explaining the discrepancy between real-life and
the napkin-math of MySQL’s theoretical, maximum throughput. We are able to
achieve an at least 5x increase in throughput from raw fsync calls due to:
- MySQL merging multiple transactions into fewer
fsyncs through ‘group commits.’ - The file-system and/or disk merging multiple
fsyncs performed in parallel through its own ‘group commits’, yielding faster performance.
In essence, the same technique of batching is used at every layer to improve performance.
While we didn’t manage to explain everything that’s going on here, I certainly learned a lot from this investigation. It’d be interesting light of this to play with changing the group commit settings to optimize MySQL for throughput over latency. This could also be tuned at the file-system level.
Problem 9: Inverted Index
Last month, we looked at the inverted index. This data-structure is what’s behind full-text search, and the way the documents are packed works well for set intersections.
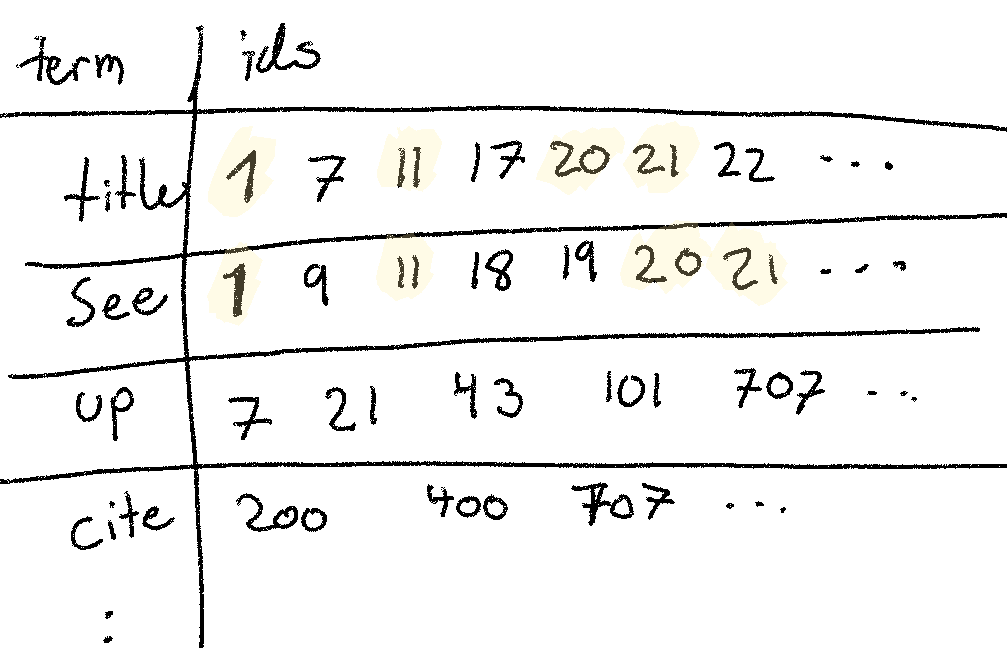
(A) How long do you estimate it’d take to get the ids for title AND see with 2
million ids for title, and 1 million for see?
Let’s assume that each document id is stored as a 64-bit integer. Then we’re
dealing with 1 * 10^6 * 64bit = 8 Mb and 2 * 10^6 * 64 bit = 16 Mb. If we
use an exceptionally simple set intersection algorithm of essentially two nested
for-loops, we need to scan ~24Mb of sequential memory. According to the
reference, we can do this in 1Mb/100us * 24Mb = 2.4ms.
Strangely, the Lucene nightly benchmarks are performing these queries at
roughly 22 QPS, or 1000ms/22 = 45ms per query. That’s substantially worse than
our prediction. I was ready to explain why Lucene might be faster (e.g. by
compressing postings to less than 64-bit), but not why it might be 20x slower!
We’ve got ourselves another first-principle gap.
Some slowness can be due to reading from disk, but since the access pattern is sequential, it should only be 2-3x slower. The hardware could be different than the reference, but hardly anything that’d explain 20x. Sending the data to the client might incur a large penalty, but again, 20x seems enormous. This type of gap points towards missing something fundamental (as we saw with MySQL). Unfortunately, this month I didn’t have time to dig much deeper than this, as I prioritized the MySQL post.
(B) What about title OR see?
In this case we’d have to scan roughly as much memory, but handle more documents
and potentially transfer more back to the client. We’d expect to roughly be in
the same ballpark for performance ~2.4ms.
Lucene in this case is doing roughly half the throughput, which aligns with our relative expectations. But again, in absolute terms, Lucene’s handling these queries in ~100ms, which is much, much higher than we expect.
(C) How do the Lucene nightly benchmarks compare for (A) and (B)? This file shows some of the actual terms used. If they don’t line up, how might you explain the discrepency?
Answered inline with (A) and (B).
(D) Let’s imagine that we want title AND see and order the results by the last modification date of each document. How long would you expect that to take?
If the postings are not stored in that order, we’d naively expect in the worst
case we’d need to sort roughly ~24Mb of memory, at
5ms/Mb. This would land us in the
5mb/mb * 24mb ~= 120ms query time ballpark.
In reality, this seems like an unintentional trick question. If ordered by last modification date, they’d already be sorted in roughly that order, since new documents are inserted to the end of the list. Which means they’re already stored in roughly the right order, meaning our sort has to move far less bits around. Even if that wasn’t the case, we could store sorted list for just this column, which e.g. Lucene allows with doc values.