Increase HTTP Performance by Fitting In the Initial TCP Slow Start Window
Did you know that if your site’s under ~12kb the first page will load significantly faster? Servers only send a few packets (typically 10) in the initial round-trip while TCP is warming up (referred to as TCP slow start). After sending the first set of packets, it needs to wait for the client to acknowledge it received all those packets.
Quick illustration of transferring ~15kb with an initial TCP slow start window
(also referred to as initial congestion window or initcwnd) of 10 versus 30:
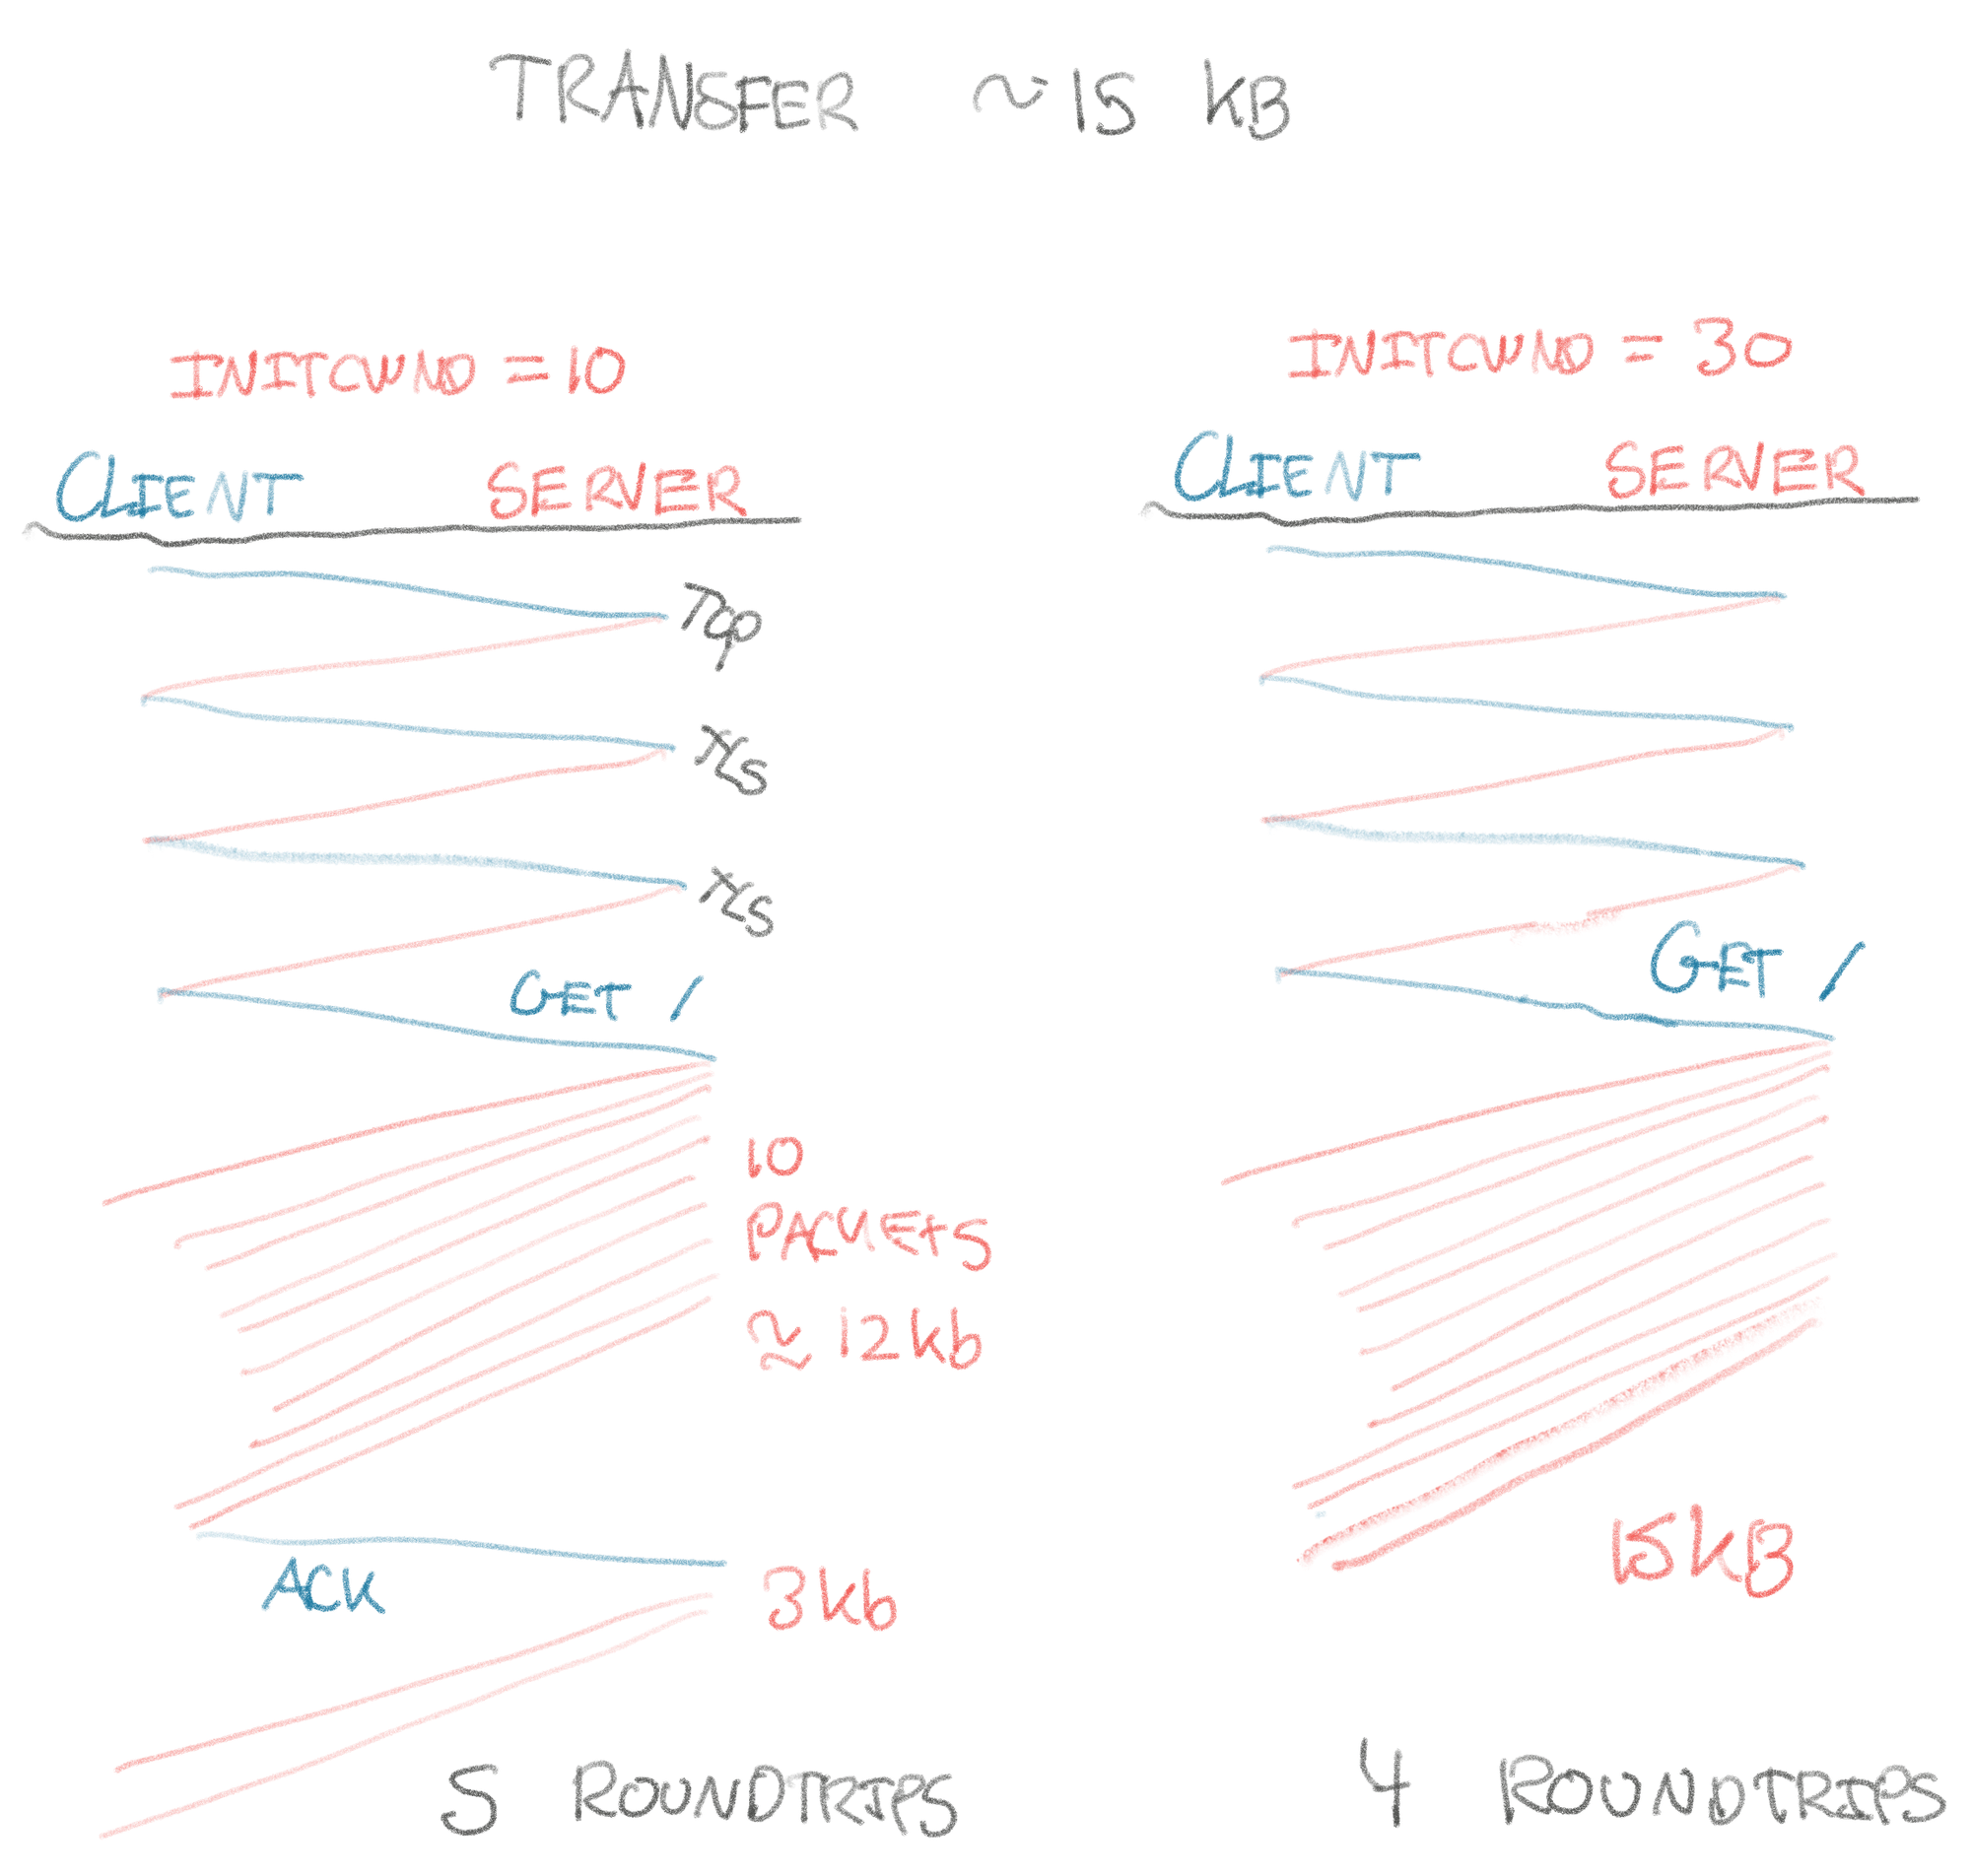
The larger the initial window, the more we can transfer in the first roundtrip, the faster your site is on the initial page load. For a large roundtrip time (e.g. across an ocean), this will start to matter a lot. Here is the approximate size of the initial window for a number of common hosting providers:
| Site | First Roundtrip Bytes (initcwnd) |
|---|---|
| Heroku | ~12kb (10 packets) |
| Netlify | ~12kb (10 packets) |
| Shopify | ~12kb (10 packets) |
| Squarespace | ~12kb (10 packets) |
| Cloudflare | ~40kb (30 packets) |
| Fastly | ~40kb (30 packets) |
| Github Pages | ~40kb (30 packets) |
| Vercel | ~40kb (30 packets) |
To generate this, I wrote a script that you can use sirupsen/initcwnd to
analyze your own site. Based on the report, you can attempt to tune your page
size, or tune your server’s initial slow start window size (initcwnd) (see
bottom of article). It’s important to note that more isn’t necessarily better
here. Hosting providers have a hard job choosing a value. 10 might be the best
setting for your site, or it might be 64. As a rule of thumb, if most of your
clients are high-bandwidth connections, more is better. If not, you’ll need to
strike a balance. Read on, and you’ll be an expert in this!
Dear Napkin Mathers, it’s been too long. Since last, I’ve left Shopify after 8 amazing years. Ride of a lifetime. For the time being, I’m passing the time with standup paddleboarding (did a 125K 3-day trip the week after I left), recreational programming (of which napkin math surely is a part), and learning some non-computer things.
In this issue, we’ll dig into the details of exactly what happens on the wire when we do the initial page load of a website over HTTP. As I’ve already hinted at, we’ll show that there’s a magical byte threshold to be aware of when optimizing for short-lived, bursty TCP transfers. If you’re under this threshold, or increase it, it’ll potentially save the client from several roundtrips. Especially for sites with a single location that are often requested from far away (i.e. high roundtrip times), e.g. US -> Australia, this can make a huge difference. That’s likely the situation you’re in if you’re operating a SaaS-style service. While we’ll focus on HTTP over the public internet, TCP slow start can also matter to RPC inside of your data-centre, and especially across them.
As always, we’ll start by laying out our naive mental model about how we think loading a site works at layer 4. Then we’ll do the napkin math on expected performance, and confront our fragile, naive model with reality to see if it lines up.
So what do we think happens at the TCP-level when we request a site? For
simplicity, we will exclude compression, DOM rendering, Javascript, etc., and
limit ourselves exclusively to downloading the HTML. In other words: curl --http1.1 https://sirupsen.com > /dev/null (note that sirupsen/initcwnd
uses --compressed with curl to reflect reality).
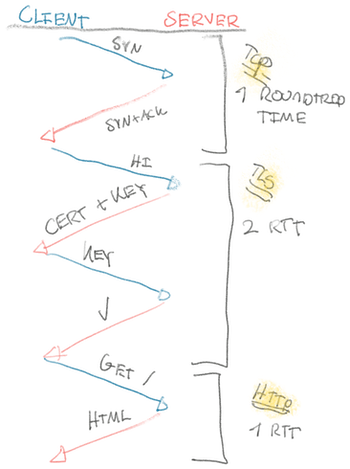
We’d expect something alone the lines of:
- 1 DNS roundtrip (we’ll ignore this one, typically cached close by)
- 1 TCP roundtrip to establish the connection (
SYNandSYN+ACK) - 2 TLS roundtrips to negotiate a secure connection
- 1 HTTP roundtrip to request the page and the server sending it
To make things a little more interesting, we’ll choose a site that is
geographically further from me that isn’t overly optimized: information.dk, a
Danish newspaper. Through some DNS lookups from servers in different geographies
and by using a looking glass, I can determine that all their HTML traffic
is always routed to a datacenter in Copenhagen. These days, many sites are
routed through e.g. Cloudflare POPs which will have a nearby data-centre, to
simplify our analysis, we want to make sure that’s not the case.
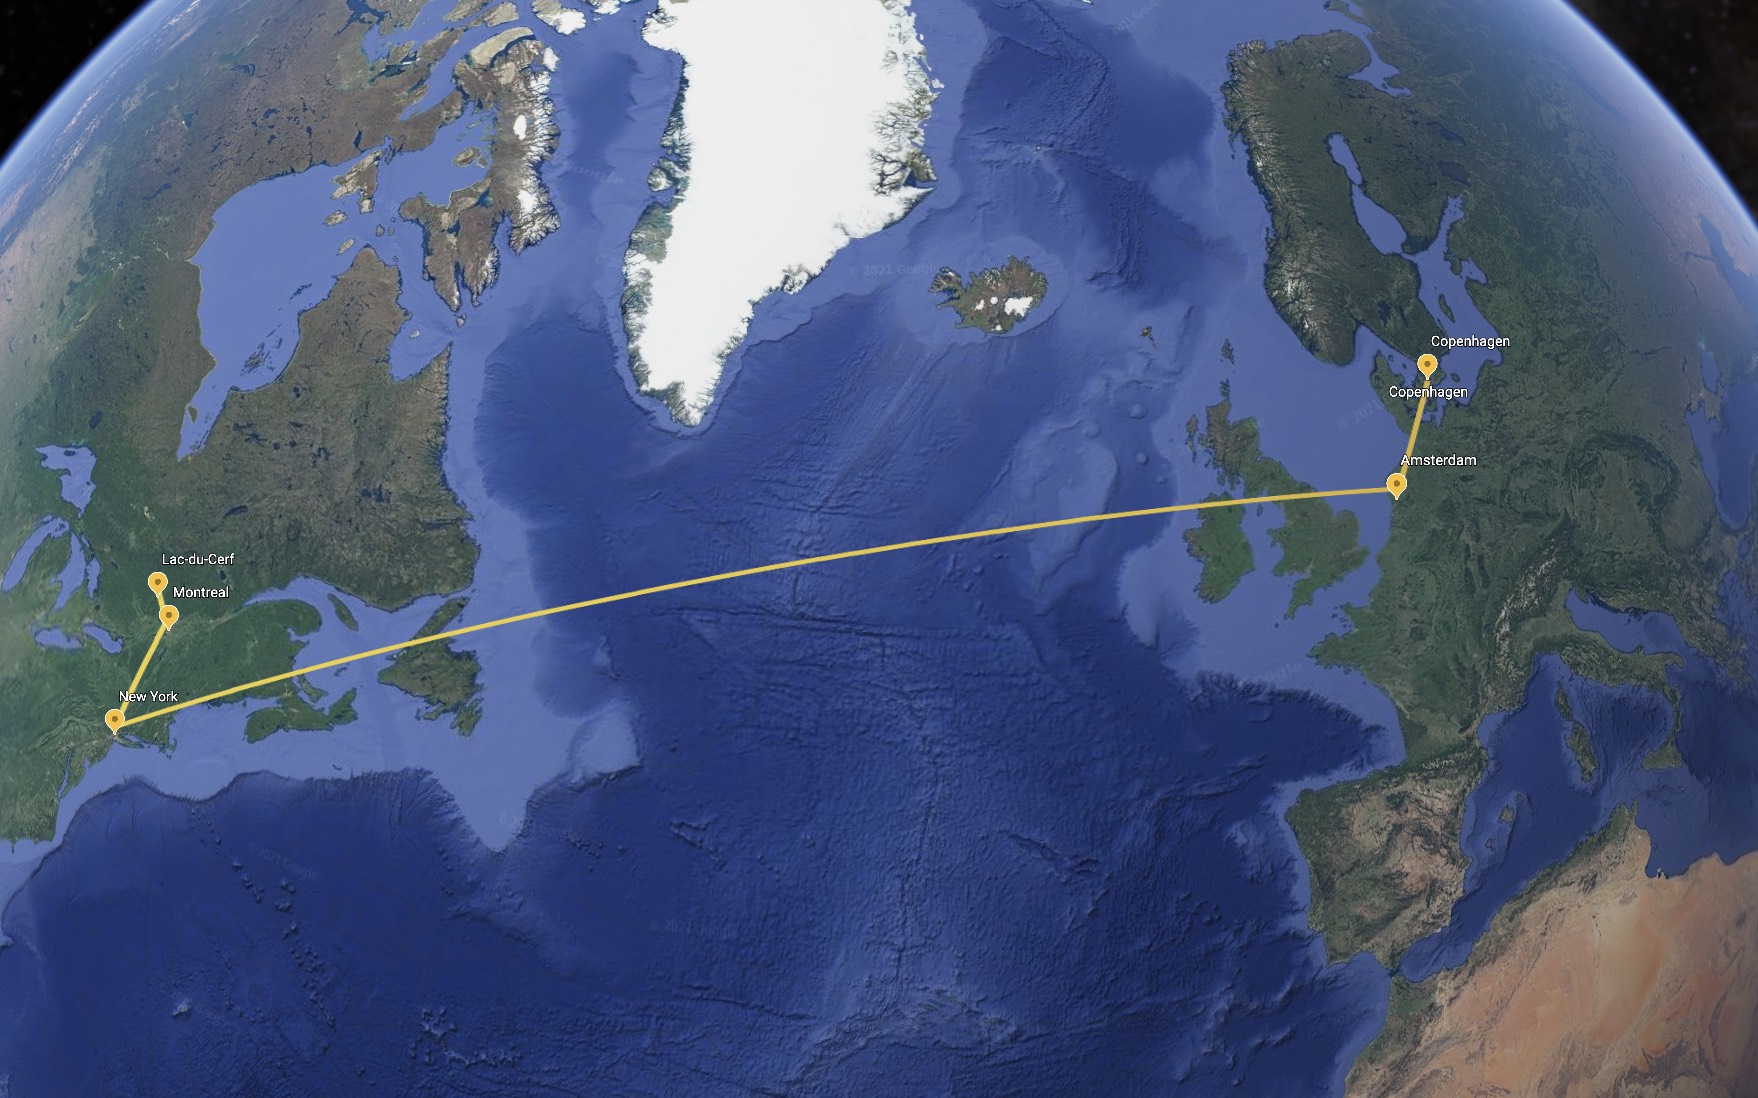
I’m currently sitting in South-Western Quebec on an LTE connection. I can
determine through traceroute(1) that my traffic is travelling to
Copenhagen through the path Montreal -> New York -> Amsterdam -> Copenhagen.
Round-trip time is ~140ms.
If we add up the number of round-trips from our napkin model above (excluding
DNS), we’d expect loading the Danish site would take us 4 * 140ms = 560ms.
Since I’m on an LTE connection where I’m not getting much above 15 mbit/s, we
have to factor in that it takes another ~100ms to transfer the data,
in addition to the 4 round-trips. So with our napkin math, we’re expecting that
we should be able to download the 160kb of HTML from a server in Copenhagen
within a ballpark of ~660ms.
Reality, however, has other plans. When I run time curl --http1.1 https://www.information.dk it takes 1.3s! Normally we say that if the napkin
math is within ~10x, the napkin math is likely in line with reality, but
that’s typically when we deal with nano and microseconds. Not off by
~640ms!
So what’s going on here? When there’s a discrepancy between the napkin math and reality, it’s because either (1) the napkin model of the world is incorrect, or (2) there’s room for optimization in the system. In this case, it’s a bit of both. Let’s hunt down those 640ms. 👀
To do that, we have to analyze the raw network traffic with Wireshark. Wireshark
brings back many memories.. some fond, but mostly… frustration trying to
figure out causes of intermittent network problems. In this case, for once it’s
for fun and games! We’ll type host www.information.dk into Wireshark to make
it capture traffic to the site. In our terminal we run the curl command above
for Wireshark to have something to capture.
Wireshark will then give us a nice GUI to help us hunt down the roughly half a
second we haven’t accounted for. One thing to note is that in order to get
Wireshark to understand the TLS/SSL contents of the session it needs to know the
secret negotiated with the server. There’s a complete guide here, but
in short you pass SSLKEYLOGFILE=log.log to your curl command and then point
to that file in Wireshark in the TLS configuration.
Problem 1: 3 TLS roundtrips rather than 2
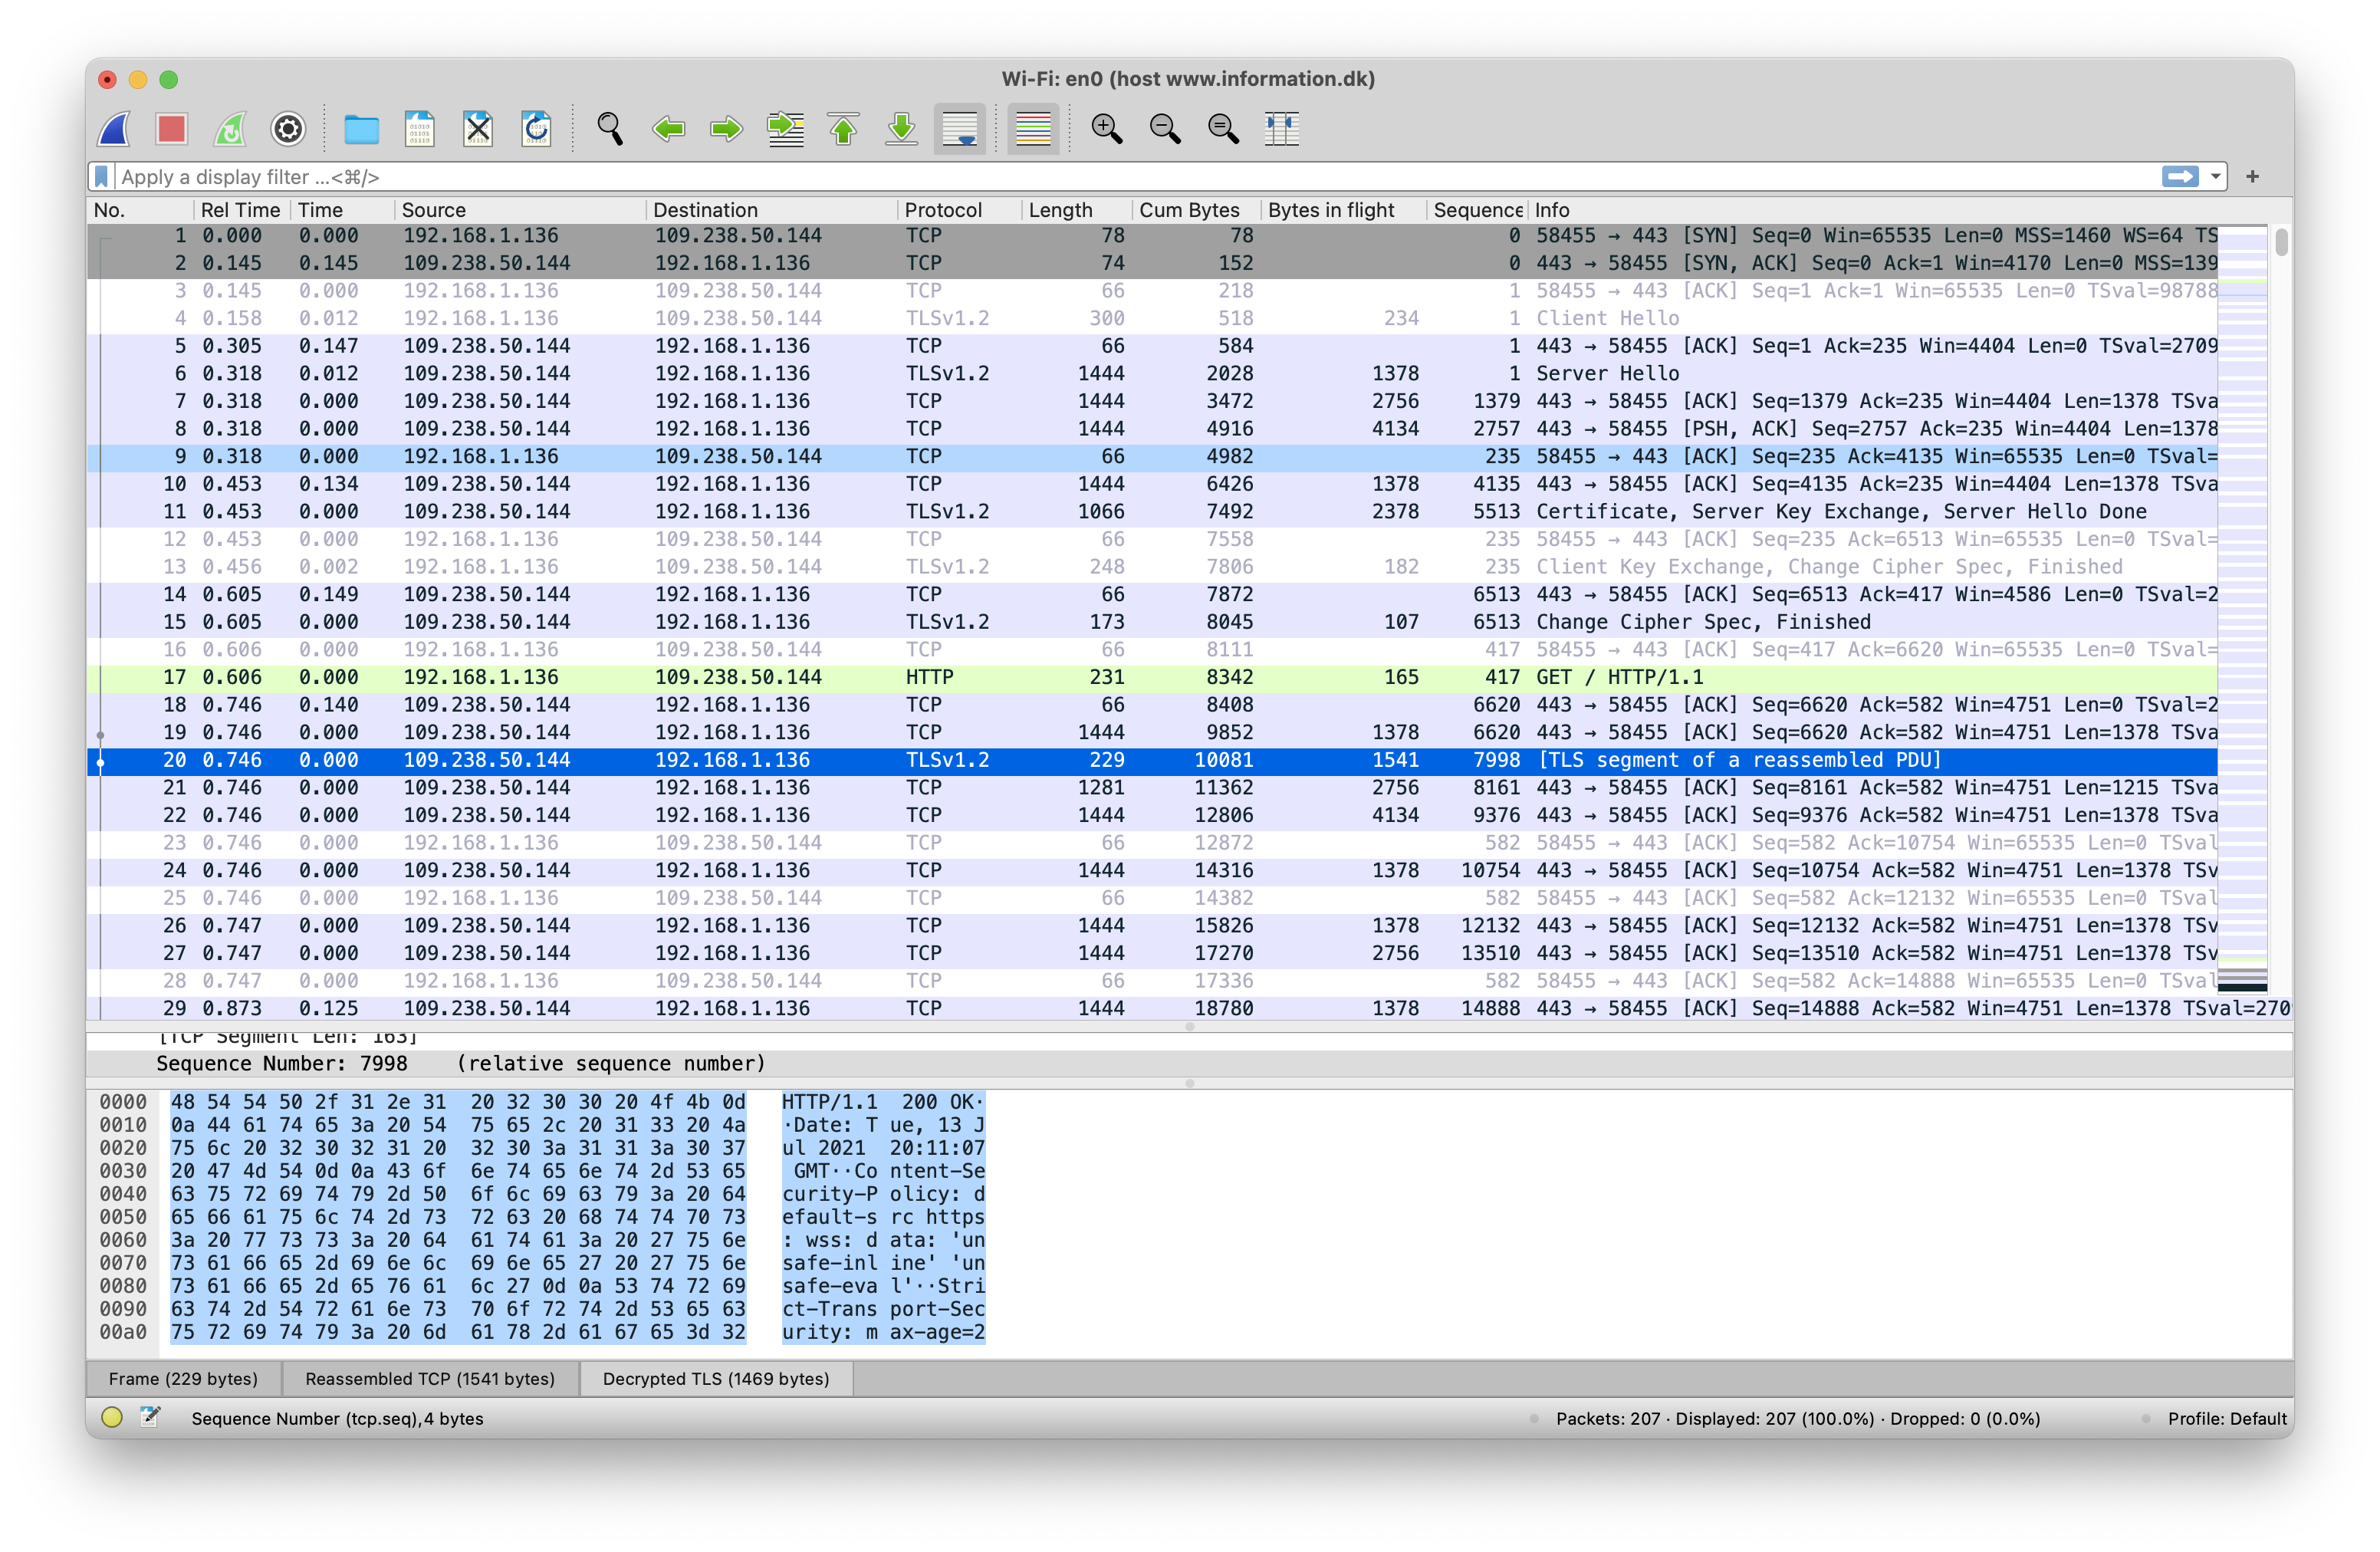
We see the TCP roundtrip as expected, SYN from the client, then SYN+ACK from
the server. Bueno. But after that it looks fishy. We’re seeing 3 round-trips
for TLS/SSL instead of the expected 2 from our drawing above!
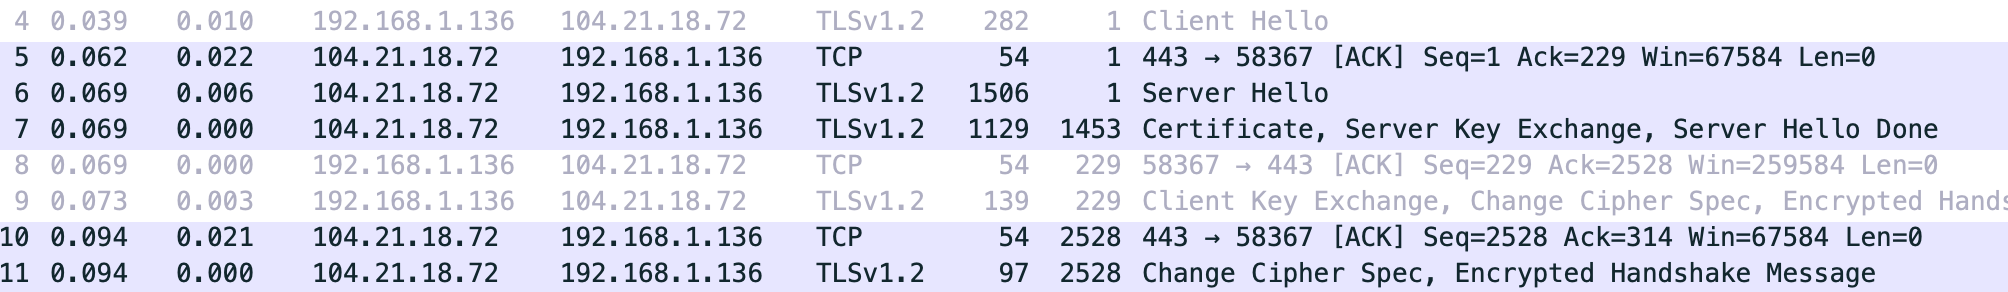
To make sure I wasn’t misunderstanding something, I double-checked with
sirupsen.com, and sure enough, it’s showing the two roundtrips in Wireshark as
anticipated:
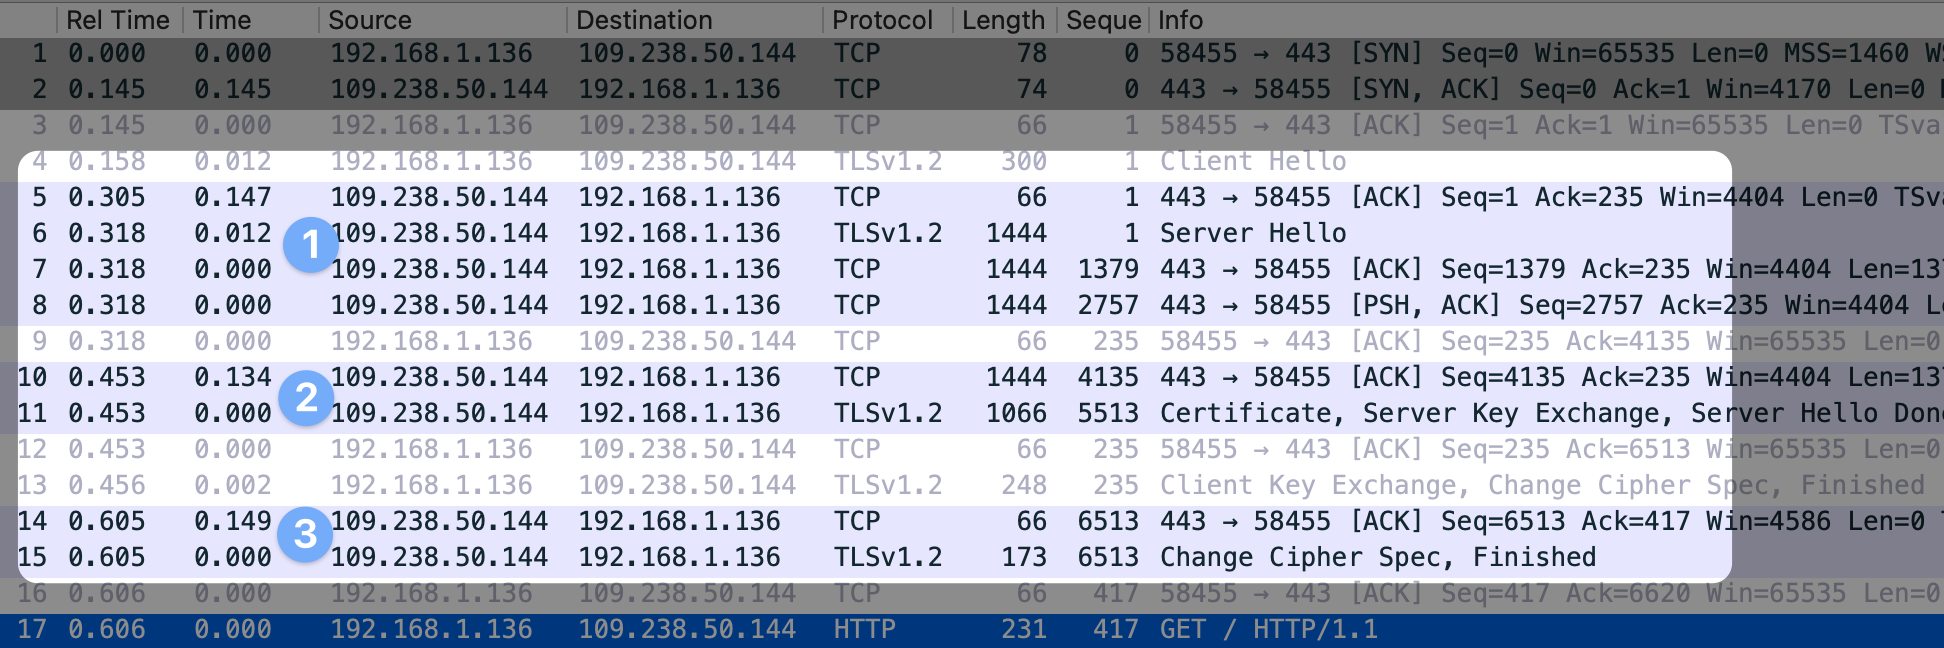
If we carefully study the annotated Wireshark dump above for the Danish newspaper, we can see that the problem is that for whatever reason the server is waiting for a TCP ack in the middle of transmitting the certificate (packet 9).
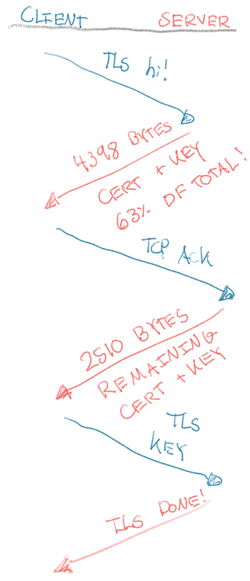
To make it a easier to parse, the exchange looks like this:
Why is the server waiting for a TCP ACK from the client after transmitting ~4398 bytes of the certificate? Why doesn’t the server just send the whole certificate at once?
Bytes in flight or the “initial congestion window”
In TCP, the server carefully monitors how many packets/bytes it has in flight. Typically, each packet is ~1460 bytes of application data. The server doesn’t necessarily send all the data it has at once, because the server doesn’t know how “fat” the pipes are to the client. If the client can only receive 64 kbit/s currently, then sending e.g. 100 packets could completely clog the network. The network most likely will drop some random packets which would be even slower to compensate from than sending the packets at a more sustainable pace for the client.
A major part of the TCP protocol is the balancing act of trying to send as much data as possible at any given time, while ensuring the server doesn’t over-saturate the path to the client and lose packets. Losing packets is very bad for bandwidth in TCP.
The server only keeps a certain amount of packets in flight at any given time.
“In flight” in TCP terms means “unacknowledged” packets, i.e. packets of data
the server has sent to the client that the client hasn’t yet sent an
acknowledgement to the server that it has received. Typically for every
successfully acknowledged packet the server’s TCP implementation will decide to
increase the number of allowed in-flight packets by 1. You may have heard this
simple algorithm referred to as “TCP slow start.” On the flip-side, if a packet
has been dropped then the server will decide to have slightly less bytes in
flight. Throughout the existence of the TCP connection’s lifetime this dance
will be tirelessly performed. In TCP terms what we’ve called “in-flight” is
referred to as the “congestion window” (or cwnd in short-form).
Typically after the first packet has been lost the TCP implementation switches from the simple TCP slow start algorithm to a more complicated “Congestion Control Algorithm” of which there are dozens. Their job is: Based on what we’ve observed about the network, how much should we have in flight to maximize bandwidth?
Now we can go back and understand why the TLS handshake is taking 3 roundtrips
instead of 2. After the client’s starts the TLS handshake with TLS HELLO, the
Danish server really, really wants to transfer this ~6908 byte certificate.
Unfortunately though the server’s congestion window (packets in flight allowed) at
the time just isn’t large enough to accommodate the whole certificate!
Put another way, the server’s TCP implementation has decided it’s not confident the poor client can receive that many tasty bytes all at once yet — so it sends a petty 4398 bytes of the certificate. Of course, 63% of a certificate isn’t enough to move on with the TLS handshake… so the client sighs, sends a TCP ACK back to the server, which then sends the meager 2510 left of the certificate so the client can move on to perform its part of the TLS handshake.
Of course, this all seems a little silly… first of all, why is the certificate 6908 bytes?! For comparison, it’s 2635 for my site. Although that’s not too interesting to me. What’s more interesting is why is the server only sending 6908 bytes? That seems scanty for a modern web server!
In TCP how many packets we can send on a brand new connection before we know
anything about the client is called the “initial congestion window.” In a
configuration context, this is called initcwnd. If you reference the yellow
graph above with the packets in flight, that’s the value at the first roundtrip.
These days, the default for a Linux server is 10 packets, or 10 * 1460 = 14600 bytes, where 1460 is roughly the data payload of each packet. That would’ve fit
that monster certificate of the Danish newspaper. Clearly that’s not their
initcwd since then the server wouldn’t have patiently waited for my ACK.
Through some digging it appears that prior to Linux 3.0.0 initcwnd was
3, or ~3 * 1460 = 4380 bytes! That approximately lines up, so it seems
that the Danish newspaper’s initcwnd is 3. We don’t know for sure it’s Linux,
but we know the initcwnd is 3.
Because of the exponential growth of the packets in flight, initcwnd matters
quite a bit for how much data we can send in those first few precious
roundtrips:
As we saw in the intro, it’s common among CDNs to raise the values from the default to e.g. 32 (~46kb). This makes sense, as you might be transmitting images of many megabytes. Waiting for TCP slow start to get to this point can take a few roundtrips.
Another other reasons, this is also why HTTP2/HTTP3 moved in the direction of moving more data through the same connection as it has an already “warm” TCP session. “Warm” meaning that the congestion window / bytes in flight has already been increased generously from the initial by the server.
The TCP slow start window is also part of why points of presence (POPs) are
useful. If you connect to a POP in front of your website that’s 10ms
away, negotiate TLS with the POP, and the POP already has a warm connection
with the backend server 100ms away — this improves performance dramatically,
with no other changes. From 4 * 100ms = 400ms to 3 * 10ms + 100ms = 130ms.
How many roundtrips for the HTTP payload?
Now we’ve gotten to the bottom of why we have 3 TLS roundtrips rather than the expected 2: the initial congestion window is small. The congestion window (allowed bytes in flight by the server) applies equally to the HTTP payload that the server sends back to us. If it doesn’t fit inside the congestion window, then we need multiple round-trips to receive all the HTML.
In Wireshark, we can pull up a TCP view that’ll give us an idea of how many
roundtrips was required to complete the request (sirupsen/initcwnd tries to
guess this for you with an embarrassingly simple algorithm):
We see the TCP roundtrip, 3 TLS roundtrips, and then 5-6 HTTP roundtrips to get the ~160kb page! Each little dot in the picture shows a packet, so you’ll notice that the congestion window (allowed bytes in flight) is roughly doubling every roundtrip. The server is increasing the size of the window for every successful roundtrip. A ‘successful roundtrip’ means a roundtrip that didn’t drop packets, and in some newer algorithms, a roundtrip that didn’t take too much time.
Typically, the server will continue to double the number of packets (~1460 bytes each) for each successful roundtrip until either an unsuccessful roundtrip happens (slow or dropped packets), or the bytes in flight would exceed the client’s receive window.
When a TCP session starts, the client will advertise how many bytes it allows in flight. This typically is much larger than the server is wiling to send off the bat. We can pull this up in the initial SYN package from the client and see that it’s ~65kb:
If the session had been much longer and we pushed up against that window, the client would’ve sent a TCP package updating the size of the receive window. So there’s two windows at play: the server manages the number of packets in flight: the congestion window. The congestion window is controlled by the server’s congestion algorithm which is adjusted based on the number of successful roundtrips, but always capped by the client’s receive window.
Let’s look at the amount of packets transmitted by the server in each roundtrip:
- TLS roundtrip: 3 packets (~4kb)
- HTTP roundtrip 1: 6 (~8kb)
- HTTP roundtrip 2: 10 (~14kb)
- HTTP roundtrip 3: 17 (~24kb)
- HTTP roundtrip 4: 29 (~41kb)
- HTTP roundtrip 5: 48 (~69kb, this in theory would have exceeded the 64kb current receive window since the client didn’t enlarge it for some reason. The server only transmitted ~64kb)
- HTTP roundtrip 6: 9 (12kb, just the remainder of the data)
The growth of the congestion window is a textbook cubic function, it has a perfect fit:

I’m not entirely sure why it follows a cubic function. I expected TCP slow start to just double every roundtrip. :shrug: As far as I can gather, on modern TCP implementation the congestion window is doubled every roundtrip until a packet is lost (as is the case for most other sites I’ve analyzed, e.g. the session in the screenshot below). After that we might move to a cubic growth. This might’ve changed later on? It’s completely up to the TCP implementation.
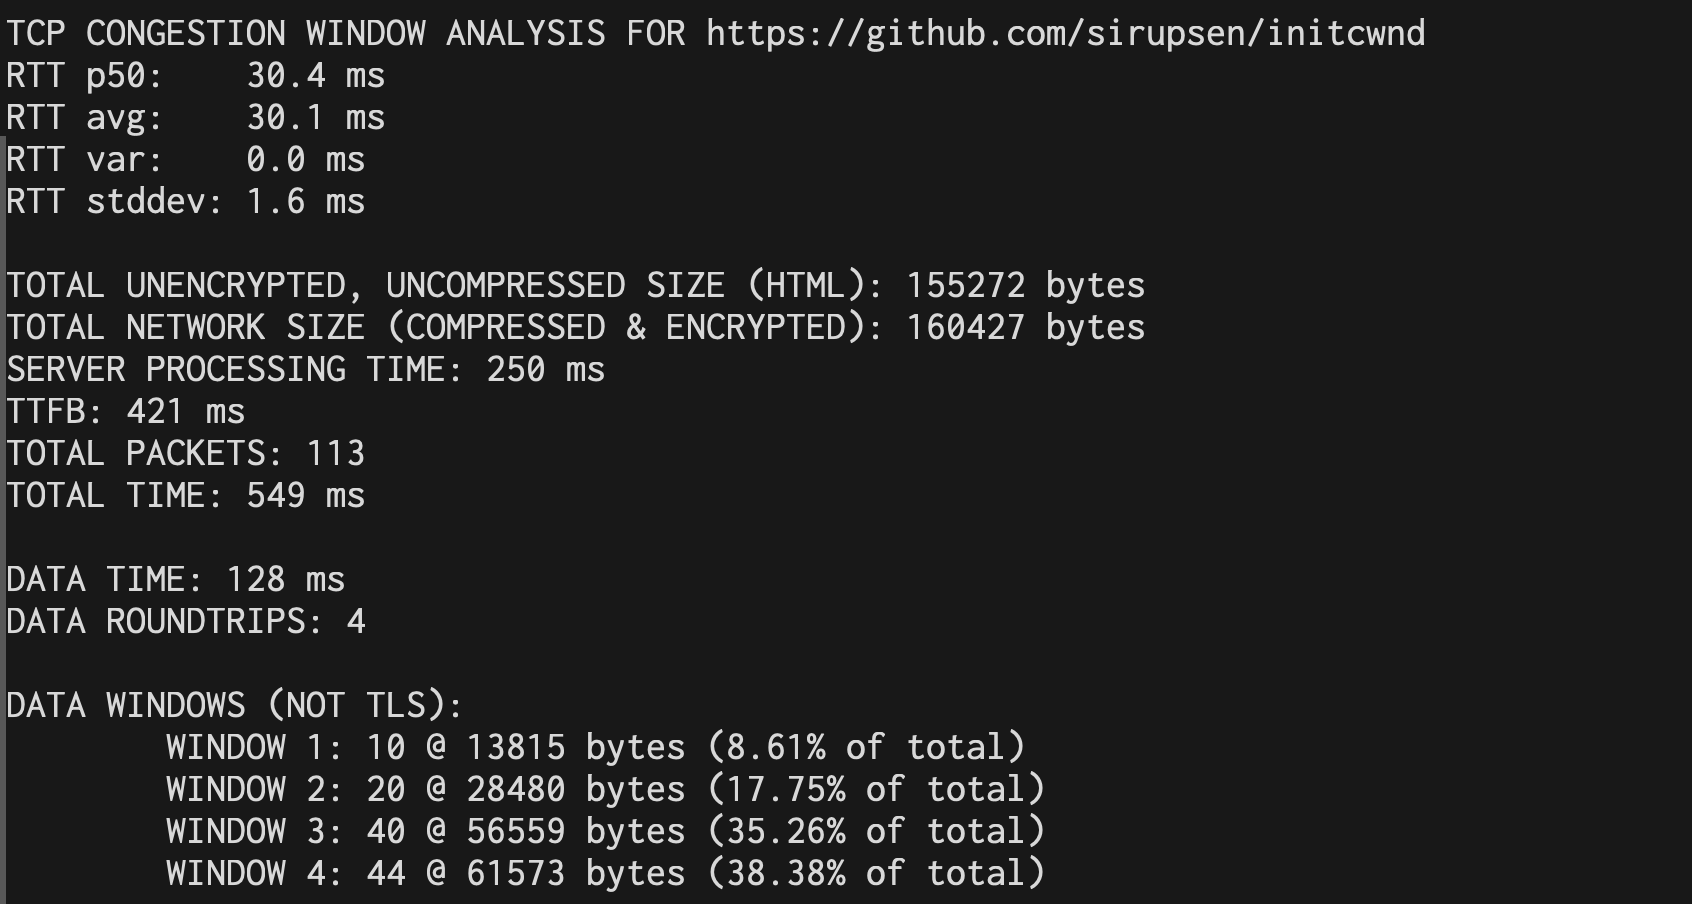
This is part of why I wrote sirupsen/initcwnd to spit out the size of the
windows, so you don’t have to do any math or guesswork, here for a Github repo
(uncompressed):
Consolidating our new model with the napkin math
So now we can explain the discrepancy between our simplistic napkin math model
and reality. We assumed 2 TLS roundtrips, but in fact there was 3, because of
the low initial congestion window by the server. We also assumed 1 HTTP
roundtrip, but in fact there was 6, because the server’s congestion window and
client’s receive window didn’t allow sending everything at once. This brings our
total roundtrips to 1 + 3 + 6 = 10 roundtrips. With our roundtrip time at
130ms, this lines up perfectly with the 1.3s total time we observed at the top
of the post! This suggests our new, updated mental model of the system reflects
reality well.
Ok cool but how do I make my own website faster?
Now that we’ve analyzed this website together, you can use this to analyze your
own website and optimize it. You can do this by running
sirupsen/initcwnd against your website. It uses some very simple
heuristics to guess the windows and their size. They don’t work always,
especially not if you’re on a slow connection or the website streams the
response back to the client, rather than sending it all at once.
Another thing to be aware of is that the Linux kernel (and likely other kernels)
caches the congestion window size (among other things) with clients via the
route cache. This is great, because it means that we don’t have to renegotiate
it from scratch when a client reconnects. But it might mean that subsequent runs
against the same website will give you a far larger initcwnd. The lowest you
encounter will be the right one. Note also that a site might have a fleet with
servers that have different initcwnd values!
The output of sirupsen/initcwnd will be something like:
Here we can see the size of the TCP windows. The initial window was 10 packets for Github.com, and then doubles every roundtrip. The last window isn’t a full 80 packets, because there wasn’t enough bytes left from the server.
With this result, we could decide to change the initcwnd to a higher value to
try to send it back in fewer roundtrips. This might, however, have drawbacks
for clients on slower connections and should be done with care. It does show
some promise that CDNs have values in the 30s. Unfortunately I don’t have access
to enough traffic to see for myself to study this, as Google did when
they championed the change from a default of 3 to 10. That document also
explains potential drawbacks in more detail.
The most practical day-to-day takeaway might be that e.g. base64 inlining images and CSS may come with serious drawbacks if it throws your site over a congestion window threshold.
You can change initcwnd with the ip(1) command on Linux, from here to the
default 10 to 32:
simon@netherlands:~$ ip route show
default via 10.164.0.1 dev ens4 proto dhcp src 10.164.0.2 metric 100
10.164.0.1 dev ens4 proto dhcp scope link src 10.164.0.2 metric 100

simon@netherlands:~$ sudo ip route change default via 10.164.0.1 dev ens4 proto dhcp src 10.164.0.2 metric 100 initcwnd 32 initrwnd 32

simon@netherlands:~$ ip route show
default via 10.164.0.1 dev ens4 proto dhcp src 10.164.0.2 metric 100 initcwnd 32 initrwnd 32
10.164.0.1 dev ens4 proto dhcp scope link src 10.164.0.2 metric 100
Another key TCP setting it’s worth tuning for TCP is
tcp_slow_start_after_idle. It’s a good name: by default when set to 1, it’ll
renegotiate the congestion window after a few seconds of no activity (while you
read on the site). You probably want to set this to 0 in
/proc/sys/net/ipv4/tcp_slow_start_after_idle so it remembers the congestion
window for the next page load.