Scaling Causal's Spreadsheet Engine from Thousands to Billions of Cells: From Maps to Arrays
This napkin math post was written for Causal about a project I worked with them on, and cross-posted on their blog. You can hire me too!
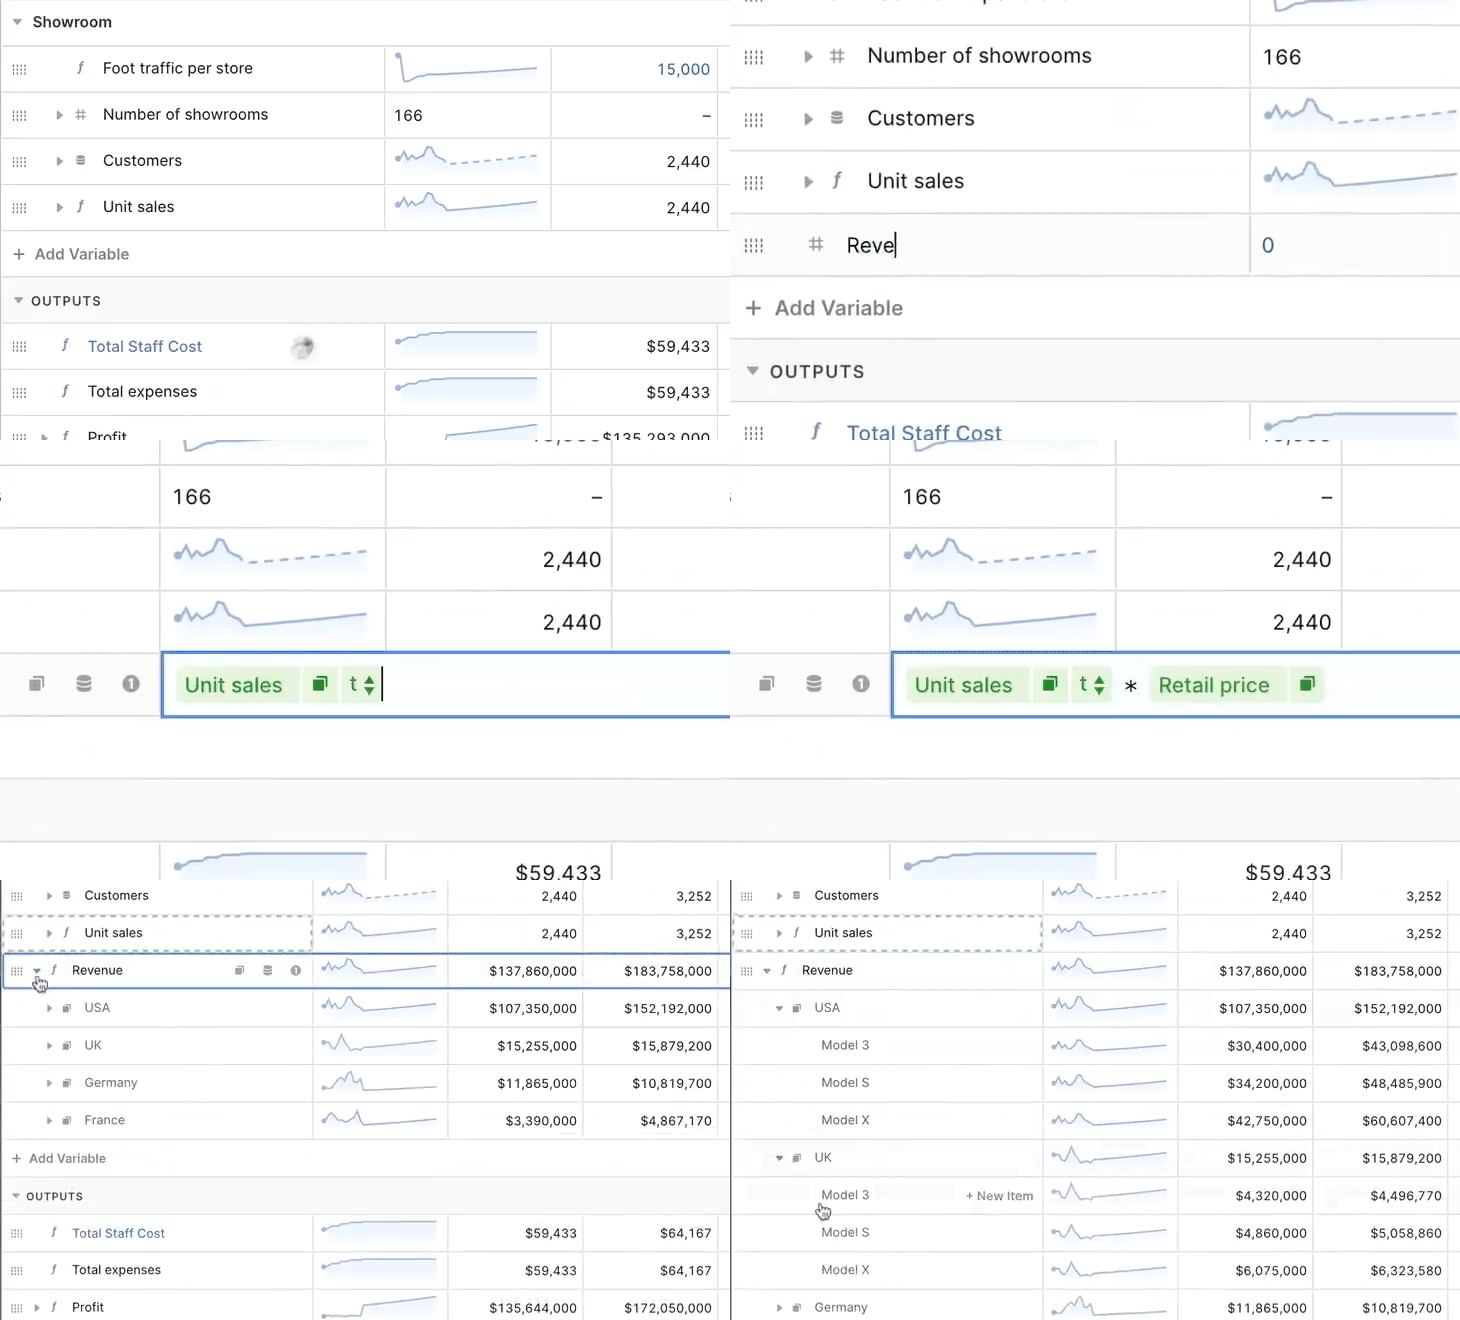
Causal is a spreadsheet built for the 21st century to help people work better
with numbers. Behind Causal’s innocent web UI is a complex calculation engine —
an interpreter that executes formulas on an in-memory, multidimensional
database. The engine sends the result from evaluating expressions like Price * Units to the browser. The engine calculates the result for each dimension such
as time, product name, country e.g. what the revenue was for a single product,
during February ‘22, in Australia.
In the early days of Causal, the calculation engine ran in Javascript in the browser, but that only scaled to 10,000s of cells. So we moved the calculation engine out of the browser to a Node.js service, getting us to acceptable performance for low 100,000s of cells. In its latest and current iteration, we moved the calculation engine to Go, getting us to 1,000,000s of cells.
But every time we scale up by an order of magnitude, our customers find new use-cases that require yet another order of magnitude more cells!
With no more “cheap tricks” of switching the run-time again, how can we scale the calculation engine 100x, from millions to billions of cells?
In summary: by moving from maps to arrays. 😅 That may seem like an awfully pedestrian observation, but it certainly wasn’t obvious to us at the outset that this was the crux of the problem!
We want to take you along our little journey of what to do once you’ve reached a dead-end with the profiler. Instead, we’ll be approaching the problem from first principles with back-of-the envelope calculations and writing simple programs to get a feel for the performance of various data structures. Causal isn’t quite at billions of cells yet, but we’re rapidly making our way there!
Optimizing beyond the profiler dead-end
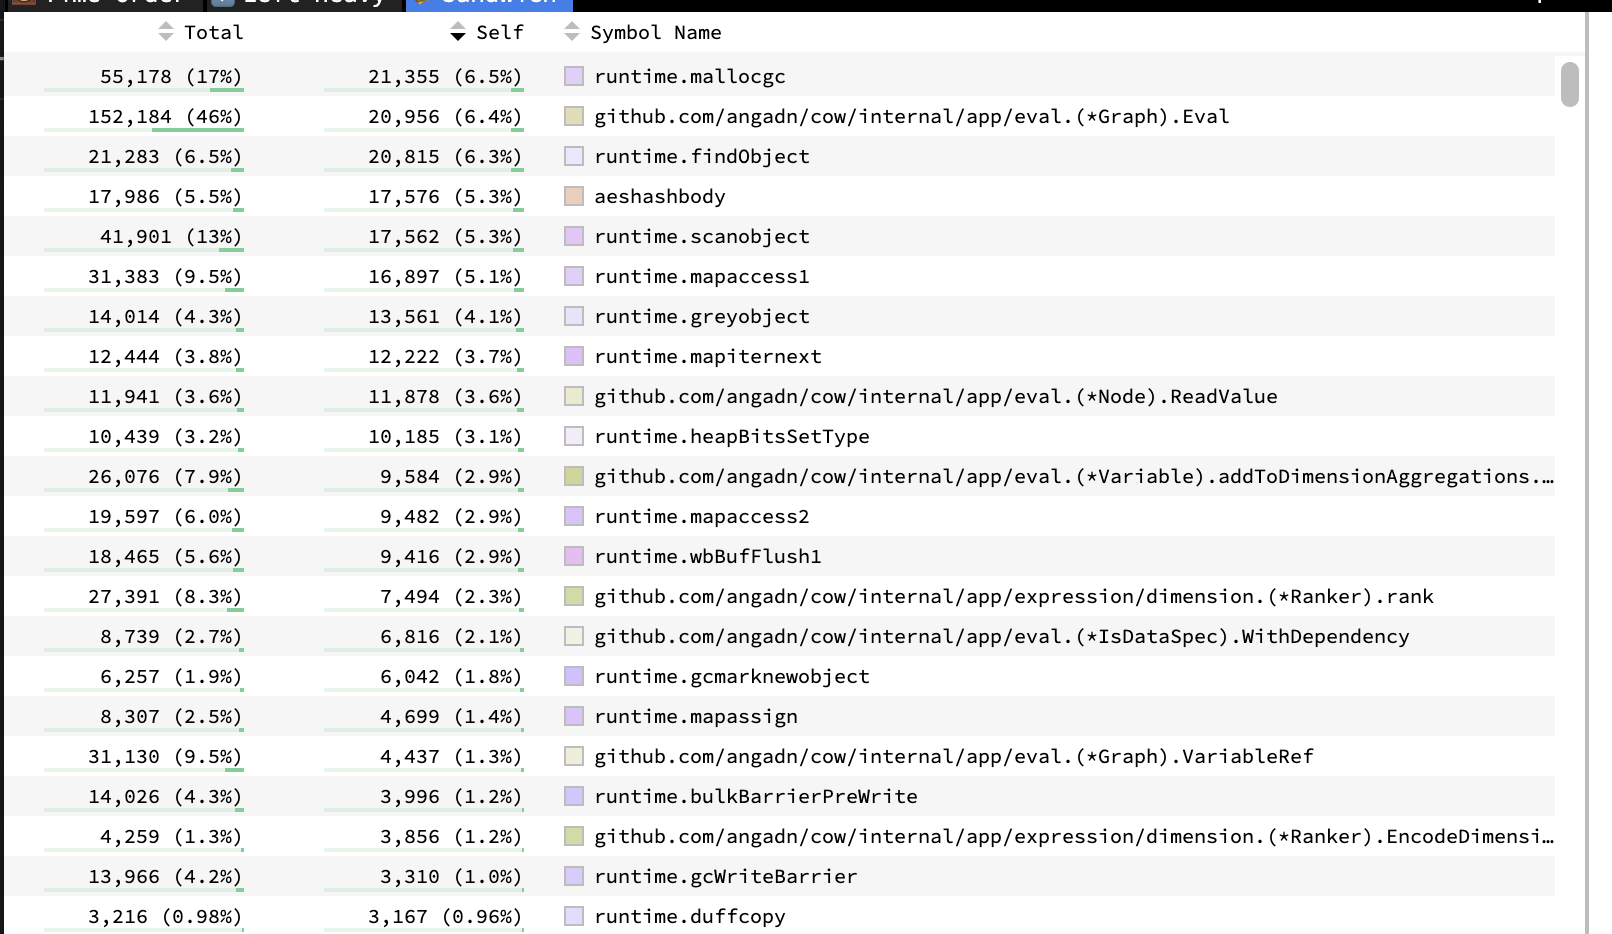
What does it look like to reach a dead-end with a profiler? When you run a profiler for the first time, you’ll often get something useful: your program’s spending 20% of time in an auxiliary function log_and_send_metrics()that you know reasonably shouldn’t take 20% of time.
You peek at the function, see that it’s doing a ridiculous amount of string allocations, UDP-jiggling, and blocking the computing thread… You play this fun and rewarding profile whack-a-mole for a while, getting big and small increments here and there.
But at some point, your profile starts to look a bit like the above: There’s no longer anything that stands out to you as grossly against what’s reasonable. No longer any pesky log_and_send_metrics() eating double-digit percentages of your precious runtime.
The constraints move to your own calibration of what % is reasonable in the profile: It’s spending time in the GC, time allocating objects, a bit of time accessing hash maps, … Isn’t that all reasonable? How can we possibly know whether 5.3% of time scanning objects for the GC is reasonable? Even if we did optimize our memory allocations to get that number to 3%, that’s a puny incremental gain… It’s not going to get us to billions of cells! Should we switch to a non-GC’ed language? Rust?! At a certain point, you’ll go mad trying to turn a profile into a performance roadmap.
When analyzing a system top-down with a profiler, it’s easy to miss the forest for the trees. It helps to take a step back, and analyze the problem from first principles.
We sat down and thought about fundamentally, what is a calculation engine? With some back-of-the-envelope calculations, what’s the upper bookend of how many cells we could reasonably expect the Calculation engine to support?
In my experience, first-principle thinking is required to break out of iterative improvement and make order of magnitude improvements. A profiler can’t be your only performance tool.
Approaching the calculation engine from first principles
To understand, we have to explain two concepts from Causal that help keep your spreadsheet organized: dimensions and variables.
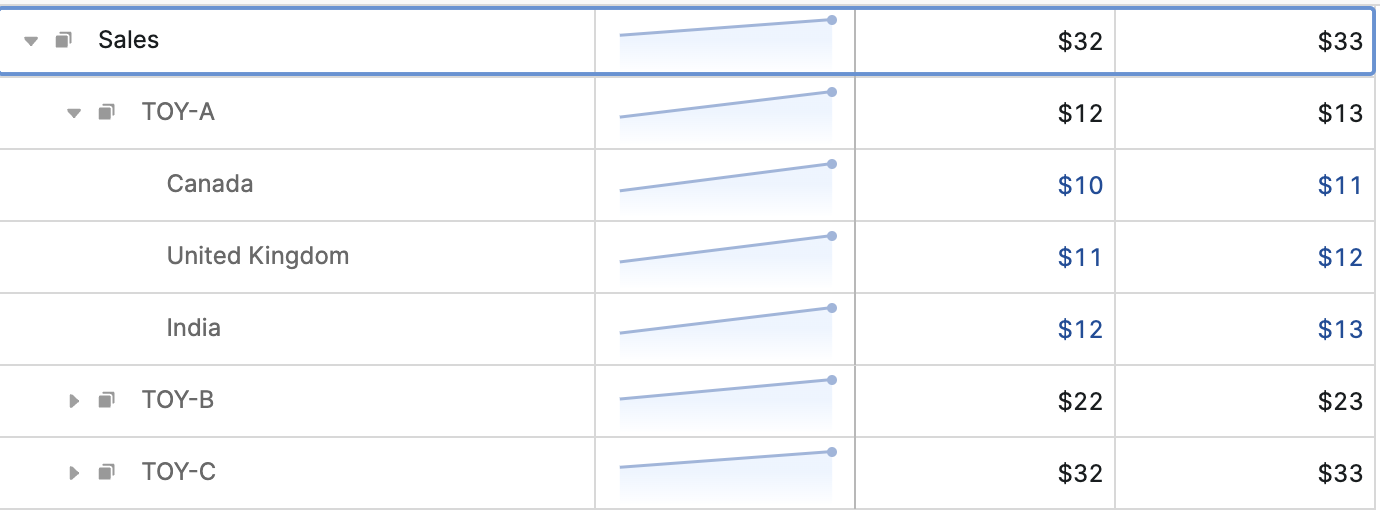
We might have a variable “Sales’” that is broken down by the dimensions “Product” and “Country”. To appreciate how easy it is to build a giant model, if we have 100s of months, 10,000s of products, 10s of countries, and 100 variables we’ve already created a model with 1B+ cells. In Causal “Sales” looks like this:
In a first iteration we might represent Sales and its cells with a map. This seems innocent enough. Especially when you’re coming from an original implementation in Javascript, hastily ported to Go. As we’ll learn in this blog post, there are several performance problems with this data structure, but we’ll take it step by step:
sales := make(map[int]*Cell)
The integer index would be the _dimension index _to reference a specific cell. It is the index representing the specific dimension combination we’re interested in. For example, for Sales[Toy-A][Canada] the index would be 0 because Toy-A is the 0th Product Name and Canada is the 0th Country. For Sales[Toy-A][United Kingdom] it would be 1 (0th Toy, 1st Country), for Sales[Toy-C][India] it would be 3 * 3 = 9.
An ostensible benefit of the map structure is that if a lot of cells are 0, then we don’t have to store those cells at all. In other words, this data structure seems useful for sparse models.
But to make the spreadsheet come alive, we to calculate formulas such as Net Profit = Sales * Profit. This simple equation shows the power of Causal’s dimensional calculations, as this will calculate each cell’s unique net profit!
Now that we have a simple mental model of how Causal’s calculation engine works, we can start reasoning about its performance from first principles.
If we multiply two variables of 1B cells of 64 bit floating points each (~8 GiB memory) into a third variable, then we have to traverse at least ~24 GiB of memory. If we naively assume this is sequential access (which hashmap access isn’t) and we have SIMD and multi-threading, we can process that memory at a rate of 30ms / 1 GiB, or ~700ms total (and half that time if we were willing to drop to 32-bit floating points and forgo some precision!).
So from first-principles, it seems possible to do calculations of billions of
cells in less than a second. Of course, there’s far more complexity below the
surface as we execute the many types of formulas, and computations on
dimensions. But there’s reason for optimism! We will carry through this example
of multiplying variables for Net Profit as it serves as a good proxy for the
performance we can expect on large models, where typically you’ll have fewer,
smaller variables.
In the remainder of this post, we will try to close the gap between smaller Go prototypes and the napkin math. That should serve as evidence of what performance work to focus on in the 30,000+ line of code engine.
Iteration 1: map[int]*Cell, 30m cells in ~6s
In Causal’s calculation engine each Cell in the map was initially ~88 bytes to store various information about the cell such as the formula, dependencies, and other references. We start our investigation by implementing this basic data-structure in Go.
With 10M cell variables, for a total of 30M cells, it takes almost 6s to compute the Net Profit = Sales * Profit calculation. These numbers from our prototype doesn’t include all the other overhead that naturally accompanies running in a larger code-base, that’s far more feature-complete. In the real engine, this takes a few times longer.
We want to be able to do billions in seconds with plenty of wiggle-room for necessary overhead, so 10s of millions in seconds won’t fly. We have to do better. We know from our napkin math, that we should be able to.
$ go build main.go && hyperfine ./main
Benchmark 1: ./napkin
  Time (mean ± σ):      5.828 s ±  0.032 s    [User: 10.543 s, System: 0.984 s]
  Range (min ... max):    5.791 s ...  5.881 s    10 runs
package main

import (
        "math/rand"
)

type Cell88 struct {
        padding [80]byte // just to simulate what would be real stuff
        value   float64
}

func main() {
        pointerMapIntegerIndex(10_000_000) // 3 variables = 30M total
}

func pointerMapIntegerIndex(nCells int) {
        one := make(map[int]*Cell88, nCells)
        two := make(map[int]*Cell88, nCells)
        res := make(map[int]*Cell88, nCells)

        rand := rand.New(rand.NewSource(0xCA0541))

        for i := 0; i < nCells; i++ {
                one[i] = &Cell88{value: rand.Float64()}
                two[i] = &Cell88{value: rand.Float64()}
        }

        for i := 0; i < nCells; i++ {
                res[i] = &Cell88{value: one[i].value * two[i].value}
        }
}
Iteration 2: []Cell, 30m cells in ~400ms
In our napkin math, we assumed sequential memory access. But hashmaps don’t do sequential memory access. Perhaps this is a far larger offender than our profile above might seemingly suggest?
Well, how do hashmaps work? You hash a key to find the bucket that this key/value pair is stored in. In that bucket, you insert the key and value. When the average size of the buckets grows to around ~6.5 entries, the number of buckets will double and all the entries will get re-shuffled (fairly expensive, and a good size to pre-size your maps). The re-sizing occurs to about equality on a lot of keys in ever-increasing buckets.
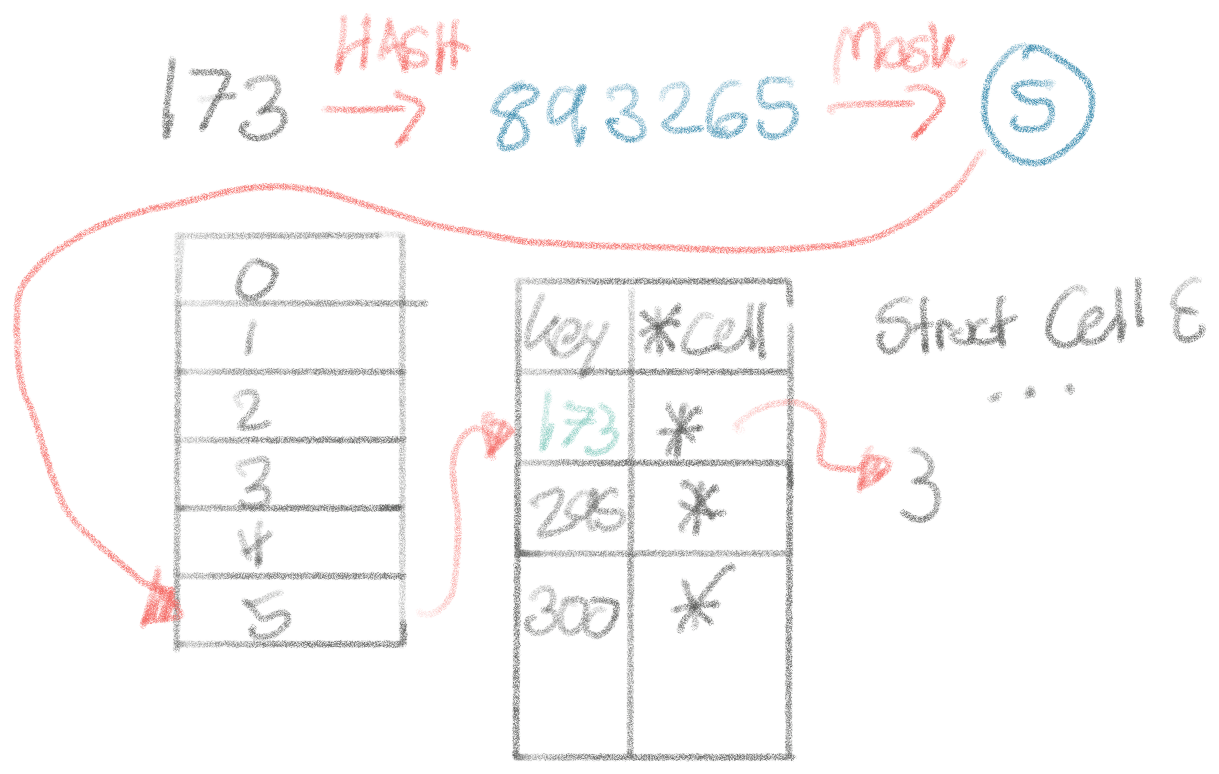
Let’s think about the performance implications of this from the ground up. Every time we look up a cell from its integer index, the operations we have to perform (and their performance, according to the napkin math reference):
- Hash the integer index to a hashed value: 25ns
- Mask the hashed value to map it to a bucket: 1-5ns
- Random memory read to map the bucket to a pointer to the bucket’s address: 1ns (because it’ll be in the cache)
- Random memory read to read the bucket: 50ns
- Equality operations on up to 6-7 entries in the bucket to locate the right key: 1-10ns
- Random memory read to follow and read the *Cell pointer: 50ns
Most of this goes out the wash, by far the most expensive are these random memory reads that the map entails. Let’s say ~100ns per look-up, and we have ~30M of them, that’s ~3 seconds in hash lookups alone. That lines up with the performance we’re seeing. Fundamentally, it really seems like trouble to get to billions of cells with a map.
There’s another problem with our data structure in addition to all the pointer-chasing leading to slow random memory reads: the size of the cell. Each cell is 88 bytes. When a CPU reads memory, it fetches one cache line of 64 bytes at a time. In this case, the entire 88 byte cell doesn’t fit in a single cache line. 88 bytes spans two cache lines, with 128 - 88 = 40 bytes of wasteful fetching of our precious memory bottleneck!
If those 40 bytes belonged to the next cell, that’s not a big deal, since we’re about to use them anyway. However, in this random-memory-read heavy world of using a hashmap that stores pointers, we can’t trust that cells will be adjacent. This is enormously wasteful for our precious memory bandwidth.
In the napkin math reference, random memory reads are ~50x slower than sequential access. A huge reason for this is that the CPU’s memory prefetcher cannot predict memory access. Accessing memory is one of the slowest things a CPU does, and if it can’t preload cache lines, we’re spending _a lot _of time stalled on memory.
Could we give up the map? We mentioned earlier that a nice property of the map is that it allows us to build sparse models with lots of empty cells. For example, cohort models tend to have half of their cells empty. But perhaps half of the cells being empty is not quite enough to qualify as ‘sparse’?
We could consider mapping the index for the cells into a large, pre-allocated array. Then cell access would be just a single random-read of 50ns! In fact, it’s even better than that: In this particular Net Profit, all the memory access is sequential. This means that the CPU can be smart and prefetch memory because it can reasonably predict what we’ll access next. For a single thread, we know we can do about 1 GiB/100ms. This is about , so it should take somewhere in the ballpark of 250-300ms. Consider also that the allocations themselves on the first few lines take a bit of time.
func arrayCellValues(nCells int) {
        one := make([]Cell88, nCells)
        two := make([]Cell88, nCells)
        res := make([]Cell88, nCells)

        rand := rand.New(rand.NewSource(0xCA0541))

        for i := 0; i < nCells; i++ {
                one[i].value = rand.Float64()
                two[i].value = rand.Float64()
        }

        for i := 0; i < nCells; i++ {
                res[i].value = one[i].value * two[i].value
        }
}
napkin:go2 $ go build main.go &&  hyperfine ./main
Benchmark 1: ./main
  Time (mean ± σ):     346.4 ms ±  21.1 ms    [User: 177.7 ms, System: 171.1 ms]
  Range (min ... max):   332.5 ms ... 404.4 ms    10 runs
That’s great! And it tracks our expectations from our napkin math well (the extra overhead is partially from the random number generator).
Iteration 3: Threading, 250ms
Generally, we expect threading to speed things up substantially as we’re able to utilize more cores. However, in this case, we’re memory bound, not computationally bound. We’re just doing simple calculations between the cells, which is generally the case in real Causal models. Multiplying numbers takes single-digit cycles, fetching memory takes double to triple-digit number of cycles. Compute bound workloads scale well with cores. Memory bound workloads act differently when scaled up.
If we look at raw memory bandwidth numbers in the napkin math reference, a 3x speed-up in a memory-bound workload seems to be our ceiling. In other words, if you’re memory bound, you only need about ~3-4 cores to exhaust memory bandwidth. More won’t help much. But they do help, because a single thread cannot exhaust memory bandwidth on most CPUs.
When implemented however, we only get a 0.6x speedup (400ms → 250ms), and not a 3x speed-up (130ms)? I am frankly not sure how to explain this ~120ms gap. If anyone has a theory, we’d love to hear it!
Either way, we definitely seem to be memory bound now. Then there’s only two ways forward: (1) Get more memory bandwidth on a different machine, or (2) Reduce the amount of memory we’re using. Let’s try to find some more brrr with (2).
Iteration 4: Smaller Cells, 88 bytes → 32 bytes, 70ms
If we were able to cut the cell size 3x from 88 bytes to 32 bytes, we’d expect the performance to roughly 3x as well! In our simulation tool, we’ll reduce the size of the cell:
type Cell32 struct {
    padding [24]byte
    value   float64
}
Indeed, with the threading on top, this gets us to ~70ms which is just around a 3x improvement!
In fact, what is even in that cell struct? The cell stores things like formulas, but for many cells, we don’t actually need the formula stored with the cell. For most cells in Causal, the formula is the same as the previous cell. I won’t show the original struct, because it’s confusing, but there are other pointers, e.g. to the parent variable. By more carefully writing the calculation engine’s interpreter to keep track of the context, we should be able to remove various pointers to e.g. the parent variable. Often, structs get expanded with cruft as a quick way to break through some logic barrier, rather than carefully executing the surrounding context to provide this information on the stack.
As a general pattern, we can reduce the size of the cell by switching from an array of structs design to a struct of arrays design, in other words, if we’re in a cell with index 328, and need the formula for the cell, we could look up index 328 in a formula array. These are called parallel arrays. Even if we access a different formula for every single cell the CPU is smart enough to detect that it’s another sequential access. This is generally much faster than using pointers.
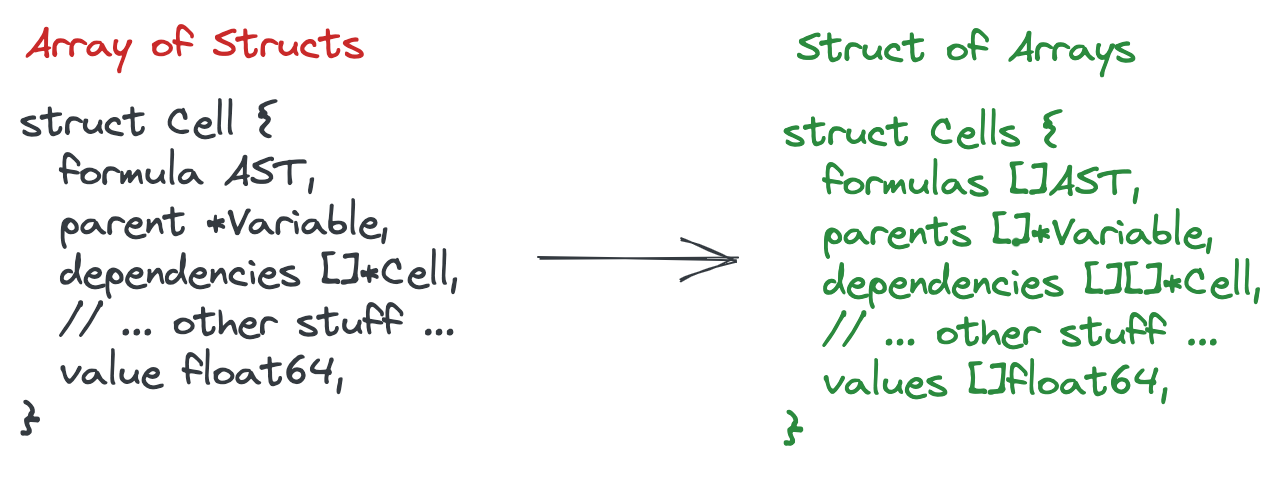
None of this is particularly hard to do, but it wasn’t until now that we realized how paramount this was to the engine’s performance! Unfortunately, the profiler isn’t yet helpful enough to tell you that reducing the size of a struct below that 64-byte threshold can lead to non-linear performance increases. You need to know to use tools like pahole(1) for that.
Iteration 5: []float64 w/ Parallel Arrays, 20ms
If we want to find the absolute speed-limit for Causal’s performance then, we’d want to imagine that the Cell is just:
type Cell8 struct {
    value   float64
}
That’s a total memory usage of which we can read at in a threaded program, so ~8ms. We won’t get much faster than this, since we also inevitably have to spend time allocating the memory.
When implemented, the raw floats take ~20ms (consider that we have to allocate the memory too) for our 30M cells.
Let’s scale it up. For 1B cells, this takes ~3.5s. That’s pretty good! Especially considering that the Calculation engine already has a lot of caching already to ensure we don’t have to re-evaluate every cell in the sheet. But, we want to make sure that the worst-case of evaluating the entire sheet performs well, and we have some space for inevitable overhead.
Our initial napkin math suggested we could get to ~700ms for 3B cells, so there’s a bit of a gap. We get to ~2.4s for 1B cells by moving allocations into the threads that actually need them, closing the gap further would take some more investigation. However, localizing allocations start to get into a territory of what would be quite hard to implement generically in reality—so we’ll stop around here until we have the luxury of this problem being the bottleneck. Plenty of work to make all these transitions in a big, production code-base!
Iteration N: SIMD, compression, GPU …
That said, there are lots of optimizations we can do. Go’s compiler currently doesn’t do SIMD, which allows us to get even more memory bandwidth. Another path for optimization that’s common for number-heavy programs is to encode the numbers, e.g. delta-encoding. Because we’re constrained by memory bandwidth more than compute, counter-intuitively, compression can make the program faster. Since the CPU is stalled for tons of cycles while waiting for memory access, we can use these extra cycles to do simple arithmetic to decompress.
Another trend from the AI-community when it comes to number-crunching too is to leverage GPUs. These have enormous memory bandwidth. However, we can create serious bottlenecks when it comes to moving memory back and forth between the CPU and GPU. We’d have to learn what kinds of models would take advantage of this, we have little experience with GPUs as a team—but we may be able to utilize lots of existing ND-array implementations used for training neural nets. This would come with significant complexity—but also serious performance improvements for large models.
Either way there’s plenty of work to get to the faster, simpler design described above in the code-base. This would be further out, but makes us excited about the engineering ahead of us!
Conclusion
Profiling had become a dead-end to make the calculation engine faster, so we needed a different approach. Rethinking the core data structure from first principles, and understanding exactly why each part of the current data structure and access patterns was slow got us out of disappointing, iterative single-digit percentage performance improvements, and unlocked order of magnitude improvements. This way of thinking about designing software is often referred to as data-oriented engineering, and this talk by Andrew Kelly, the author of the Zig compiler, is an excellent primer that was inspirational to the team.
With these results, we were able to build a technical roadmap for incrementally moving the engine towards a more data-oriented design. The reality is _far _more complicated, as the calculation engine is north of 40K lines of code. But this investigation gave us confidence in the effort required to change the core of how the engine works, and the performance improvements that will come over time!
The biggest performance take-aways for us were:
- When you’re stuck with performance on profilers, start thinking about the problem from first principles
- Use indices, not pointers when possible
- Use array of structs when you access almost everything all the time, use struct of arrays when you don’t
- Use arrays instead of maps when possible; the data needs to be very sparse for the memory savings to be worth it
- Memory bandwidth is precious, and you can’t just parallelize your way out of it!
Causal doesn’t smoothly support 1 billion cells yet, but we feel confident in our ability to iterate our way there. Since starting this work, our small team has already improved performance more than 3x on real models. If you’re interested in working on this with Causal, and them get to 10s of billions of cells, you should consider joining the Causal team — email lukas@causal.app!