Mental Modeling
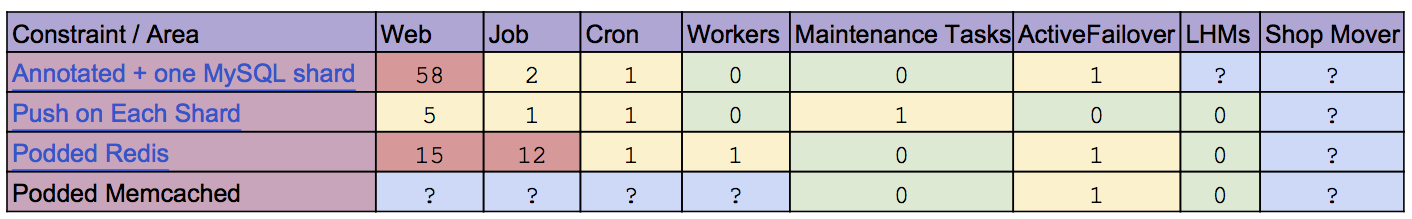
Recently I’ve started experimenting with forcing visuals into nearly all problems I solve to gain perspective. Whenever I feel the complexity of a problem rises above me, I try to stop and draw a suiting visual for the problem. I’ve found that even for the problems that appear simple, a mental model often uncovers missing pieces. When you don’t have a crystal clear overview of a problem, it becomes easy to miss something. For example, at Shopify we use a tool called the resiliency matrix to map the dependencies between various databases and services to the overall responsibilities of the application. We use this tool to point out single points of failure.

Coming up with the individual cells of this matrix is hard. Coming up with rows and columns is easy. Having this visual makes it difficult to miss anything. It becomes the overview you’ve been struggling to string together a mental model for.
For the current project I’m working on, I was struggling to get a good overview, and felt I was missing a handful of things. The team was struggling to get a sense of progress. We came up with a matrix that gives an idea of progress of the project at a glance:
These models also serve as a domain specific to-do lists: once every cell is green / yellow / zero, we’ve accomplished the task at hand. These success metrics can help create a successful feedback loop for a team as shown in the diagram below. Productivity comes out of the feedback loop being as tight as possible. The visual also serves as a way to indicate progress to the team. If your success metrics don’t improve with activity, you need to re-establish either or both of them.
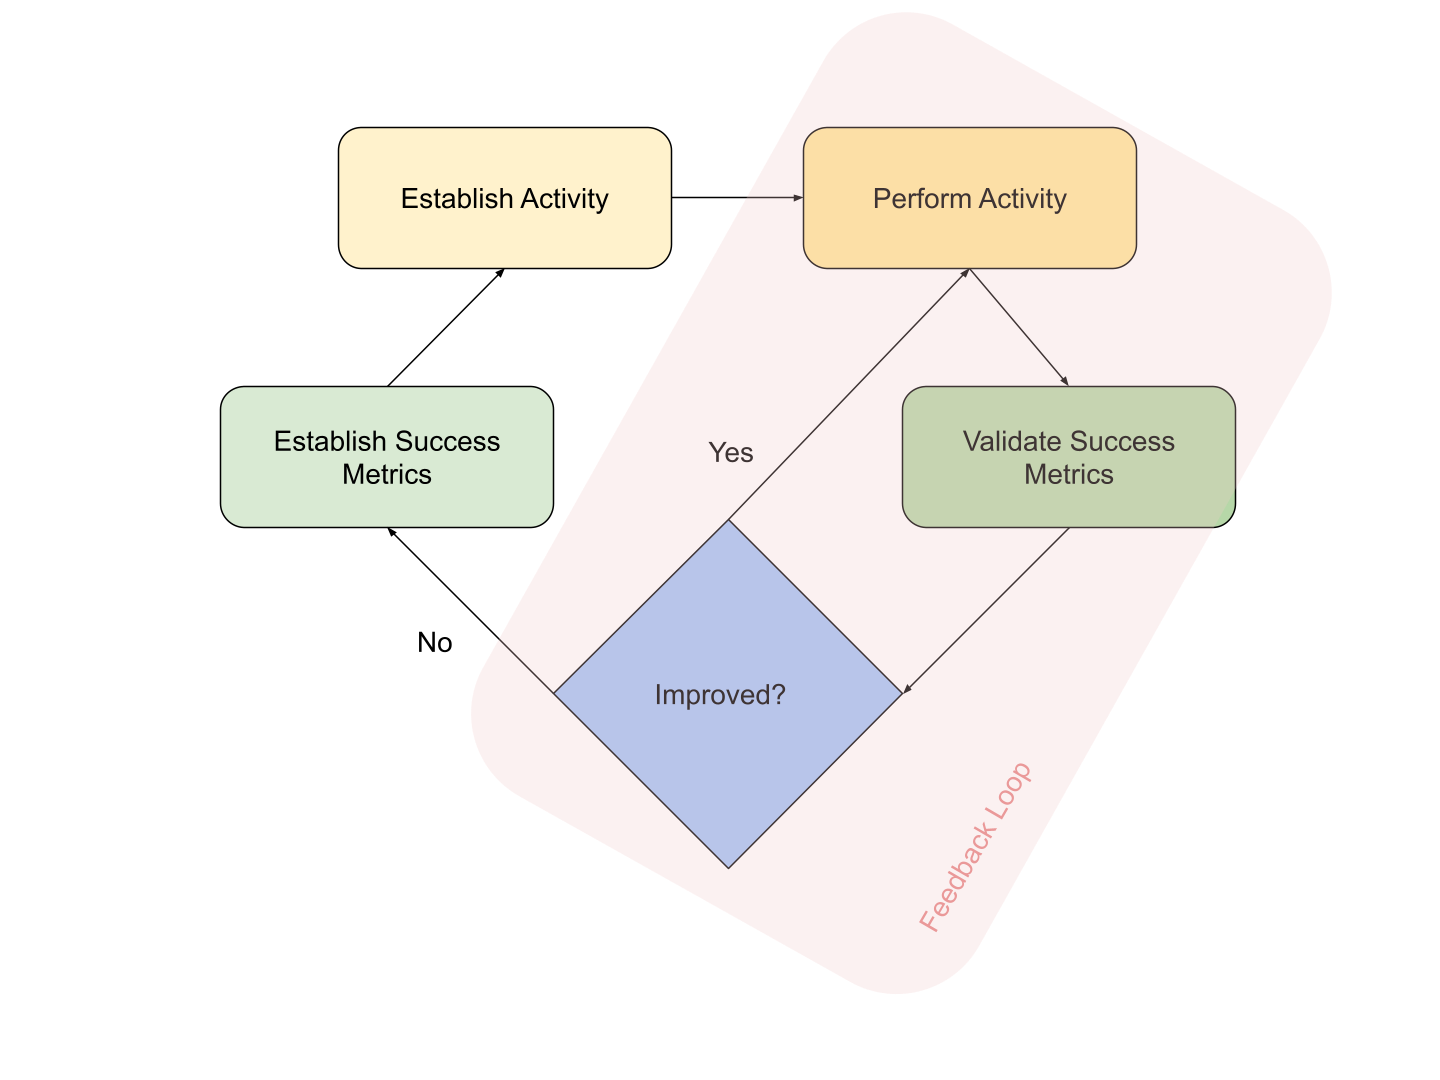
One task might be made up of several activity-metric loops. Each their own effective activities and success metrics. To flip the status of a cell in the big picture, you might have to write code, where your success metric is that your tests passes. You can tighten the feedback loop here by reducing the amount of time it takes to run the tests. Fast tests makes it much easier to enter flow. Each cell might have its own success metric matrices.
These models pop up everywhere. When I first saw the Eisenhower matrix, it gave me a new perspective on thinking about important and urgent tasks.
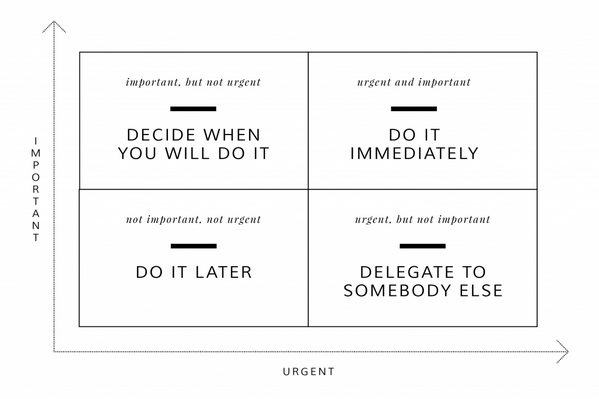
It teaches you that you must not focus purely on the important+urgent. You need to spend time thinking about the important before it becomes urgent. This gives you much higher leverage once the task enters the top-right cell. If you’re spending all your time in the important+urgent box, you’re losing.
Imagine if the team that came up with the standard layer 4 protocols, UDP and TCP, had put down a matrix?
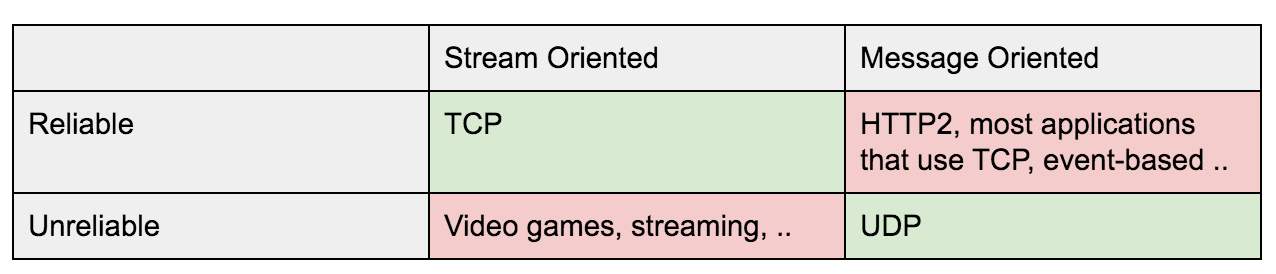
Immediately it would’ve been obvious what was missing. Yes, you can build these protocols on top of UDP, but if SCTP was standard (occupying the reliable / message oriented cell) tens of thousands of human hours would’ve been spared reimplementing reliable message oriented protocols (like HTTP2). Same goes for an unreliable streaming transport.
Matrices are effective for many problems, but often a completely different visualization can shed new light on a problem. For example, you may want to approximate the length of various tasks (based on their risk, amount of work, current knowledge, ..) that make up the project (not accounting for the unknown tasks that will likely appear). You draw a diagram like the one below, trying to approximate the time each task will take with your team:
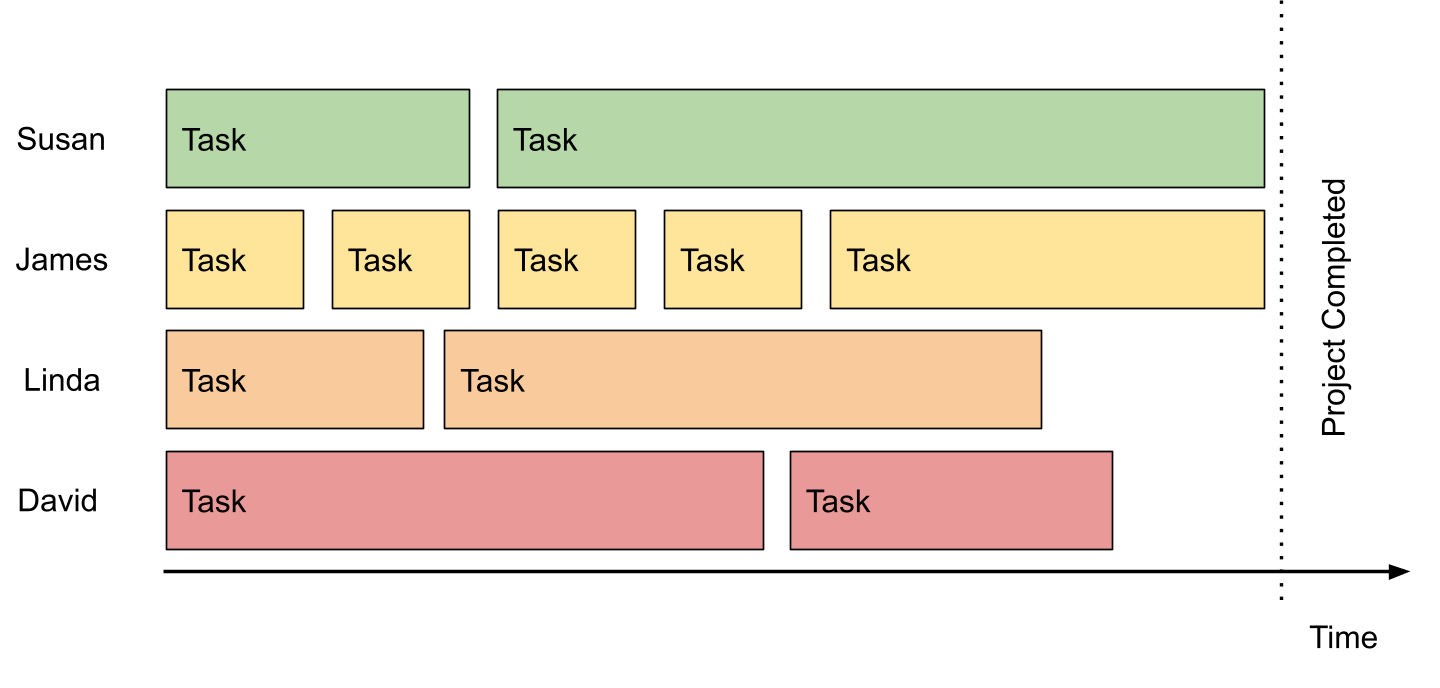
Seeing the project from this angle can raise some interesting questions:
- Why is James’ average task time smaller?
- If you gave one of James’ tasks to Linda, and found a way to split Susan’s second task in two, the project might get done sooner.
- Why are so many of the largest tasks saved to the last moment?
Especially that last point is interesting. When an estimate is long, it’s usually because the task has many unknowns, and unknown unknowns. This means it’s a task at risk to take longer than estimated. Wouldn’t it be better to do those high-risk tasks early to uncover these problems sooner rather than later? This allows adjusting priorities more efficiently and possibly extend the team. In the best case it takes less time than estimated, in which case a huge load is off your shoulders and you’re free to re-balance tasks more efficiently.
Every time you visualize a project, task, or idea from a new angle, you always see something new. It’s never a waste of time to gain new perspective on something important. Stop. Draw.